What is the Deploy Feature?
The Deploy Dashboard helps teams monitor and optimize their deployment activities by tracking deployment frequency, success rates, and historical trends.
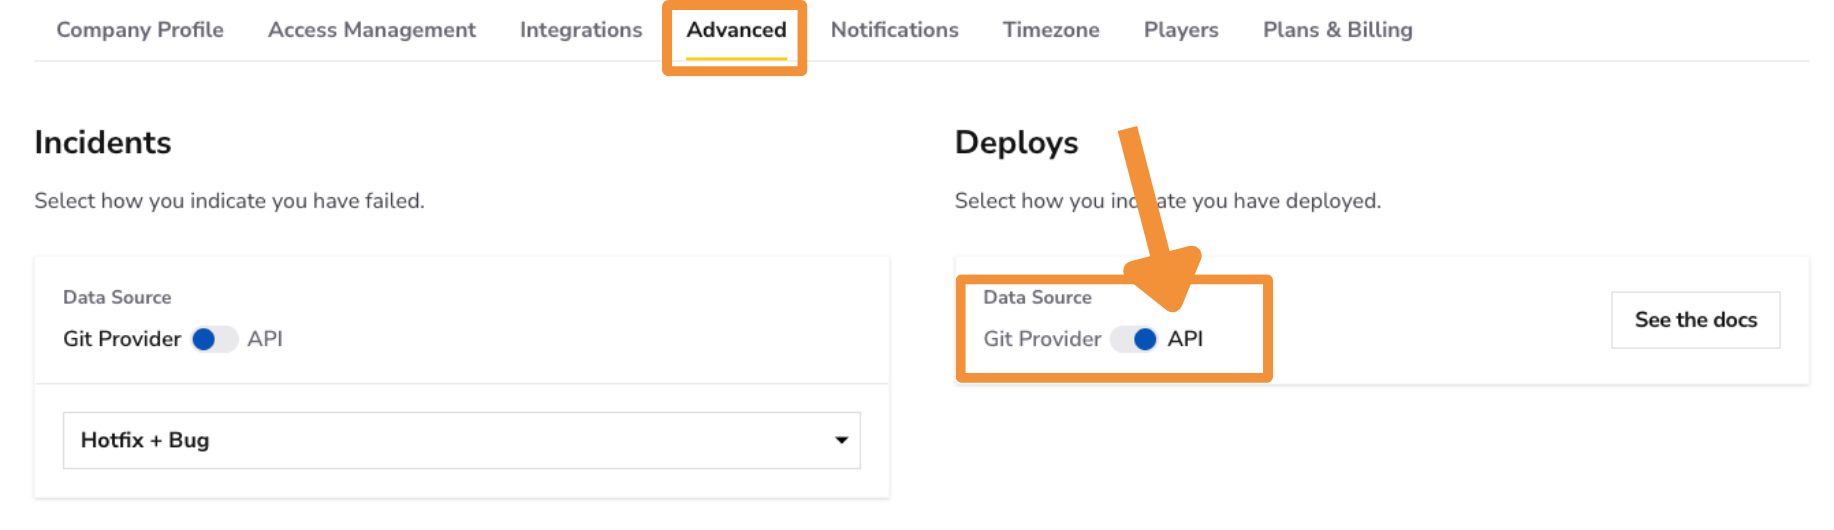
You can integrate the DevStats API into your CI/CD pipeline to submit precise deployment data for enhanced accuracy. Follow this guide!
How It Works
DevStats tracks deployments through two methods: automatically via your Git provider, or manually via the DevStats API integrated into your CI/CD pipeline.
Data Sources
| Source | How deploys are detected |
|---|---|
| Git Provider — Merge to a branch | Merges to the deploy branch configured for each repository |
| Git Provider — Release | Published releases on GitHub or GitLab, using the release publication timestamp; drafts and prereleases are excluded |
| API | Deployment data submitted directly via the DevStats API from your CI/CD pipeline |
Choose the workspace's deployment source in Settings → Deploys. With branch detection, each repository can have its own deploy branch. With Release, the setting applies across the workspace, and repositories on unsupported providers do not report deploys.
Existing Git tag configurations remain supported. The current settings offer branch merges or releases for workspaces with eligible repositories.
See Deploys settings for eligibility, setup instructions, and historical release processing.
Metrics
Deploys
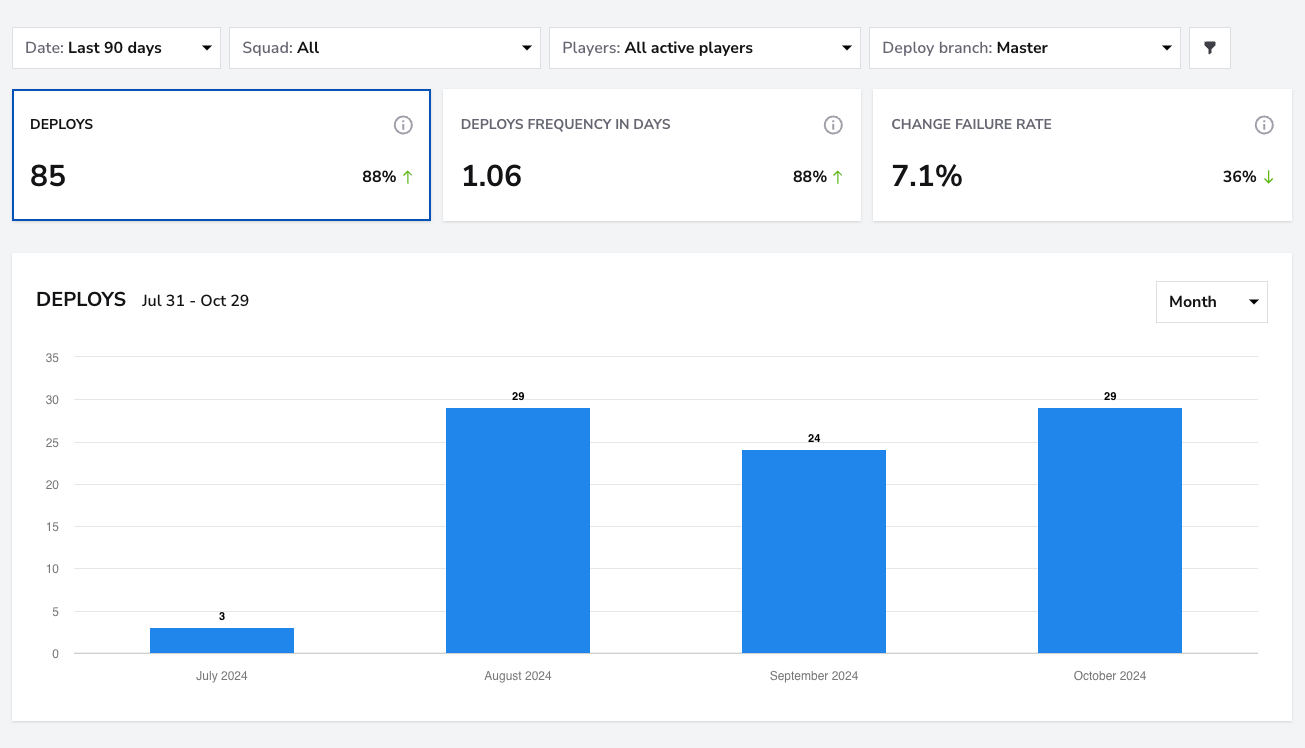
- What: Total number of deployments within the selected time frame.
- How to use it: Track this over time to ensure a steady release cadence. Frequent deployments mean smaller, more manageable changes and lower risk per release.
- User interface:
Deploy Frequency in Days
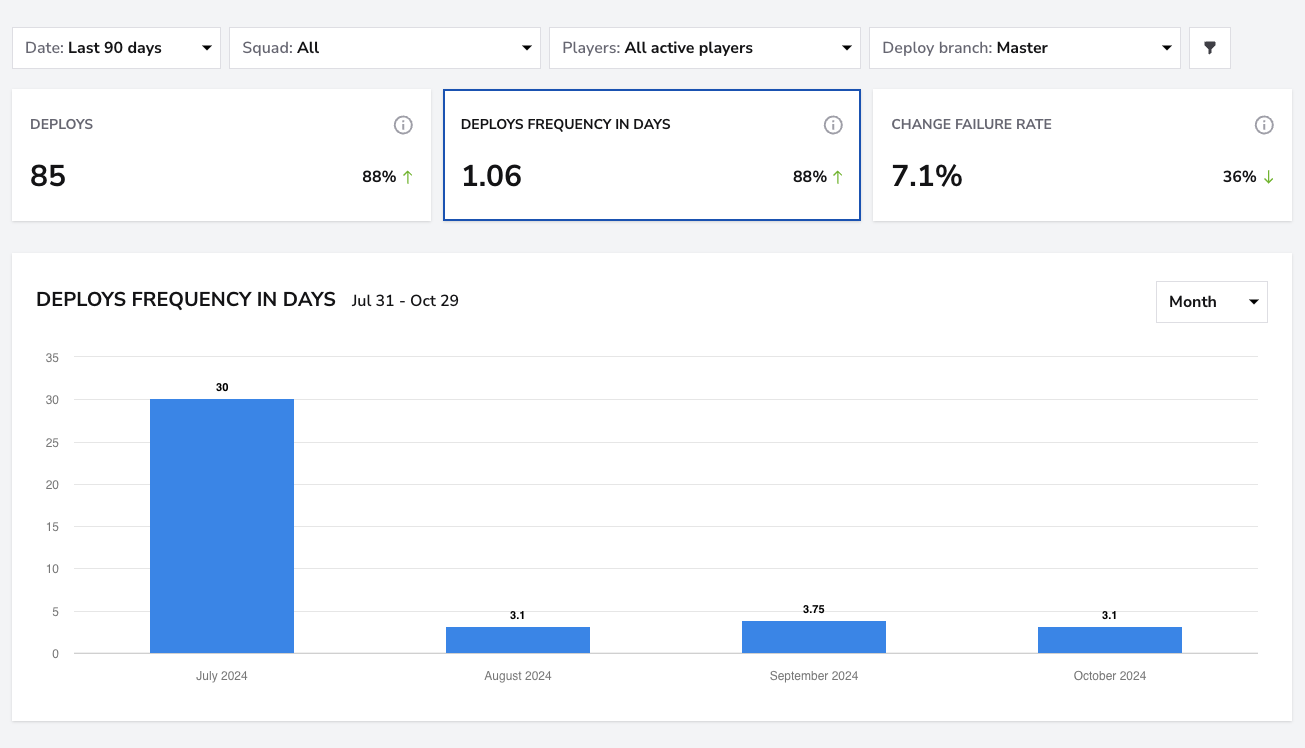
- What: Average number of days between deployments across all integrated repositories. Can be filtered by specific repository.
- How to use it: A lower value means more frequent deployments. Aim to keep this low to reduce the risk of large, disruptive releases and accelerate time-to-market.
- User interface:
Change Failure Rate
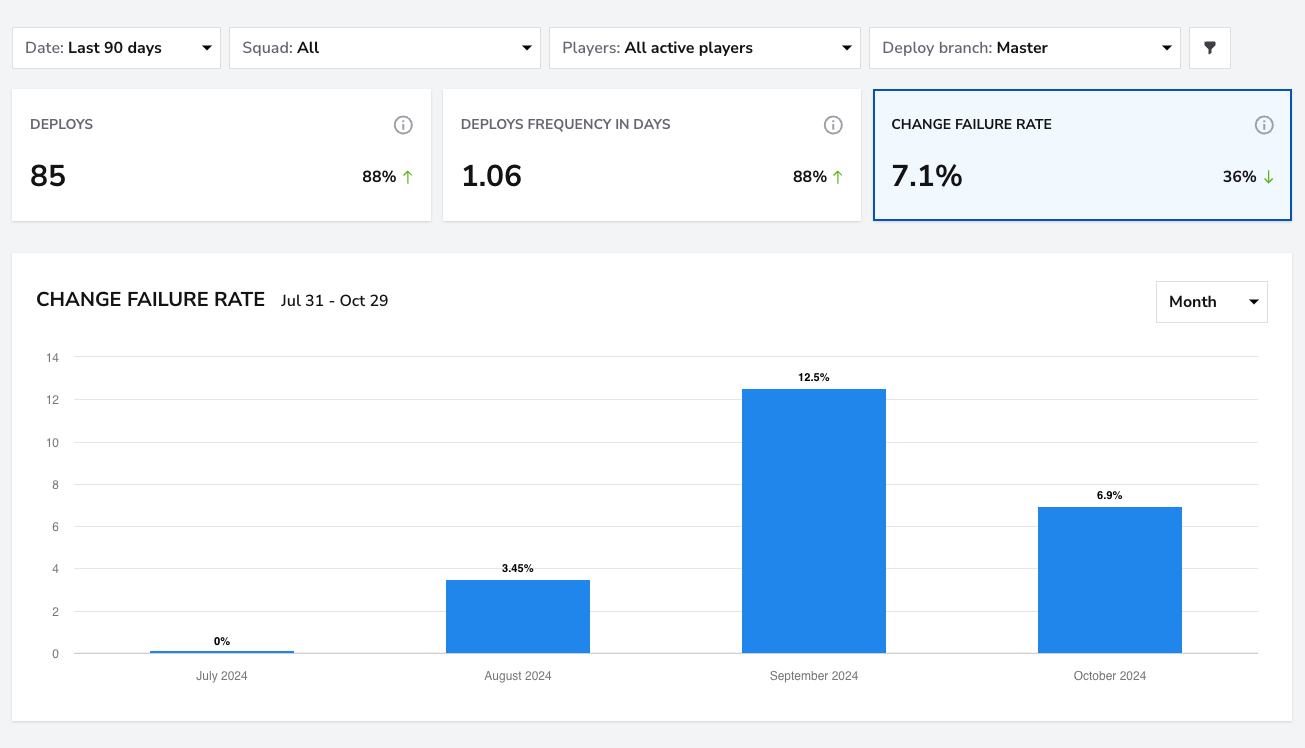
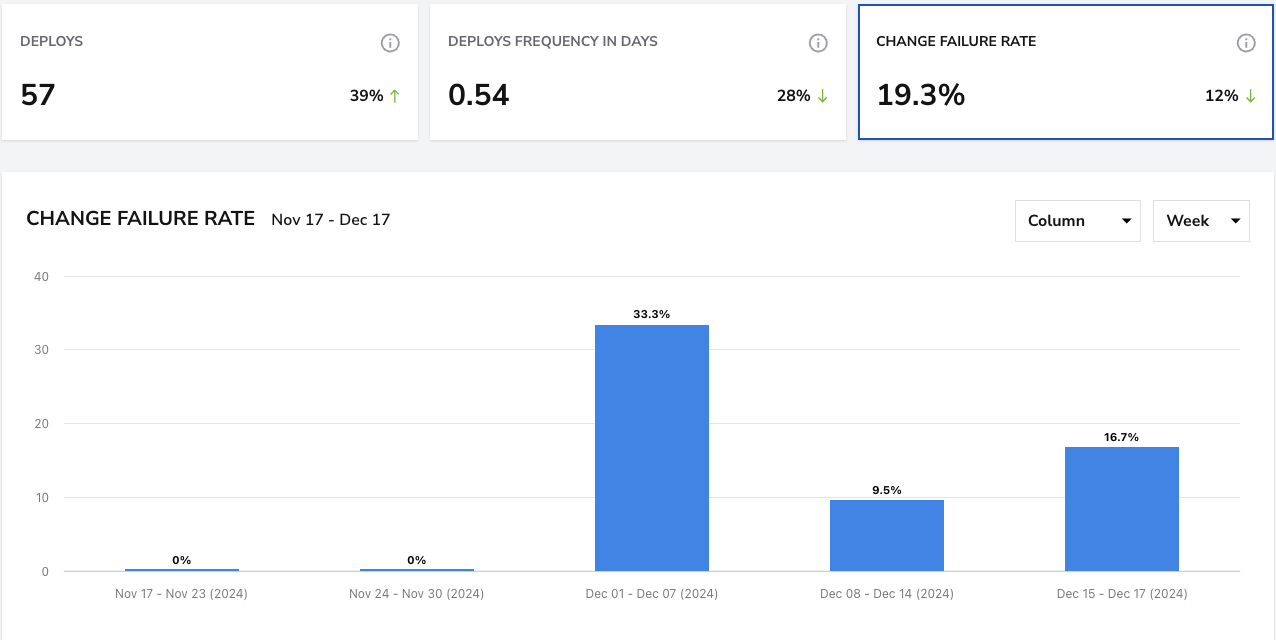
- What: Percentage of deployments that required remediation in production (e.g. hotfix, bugfix).
- How to use it: A high rate points to insufficient testing or integration issues. See DORA Metrics for the full calculation and failure detection methods.
- User interface:
Deploy Dashboard
The Deploy feature includes a bar chart that visually represents deployments over a selected period, broken down by days, weeks, or months. Below the chart, you can find a list of all PRs. If you click on the arrow next to one of the PRs, you'll get a detailed overview of that PR.
Filters
Use the Squad Filter to view deploy metrics for individual squads. If you want a broader overview of all teams, select the "All" filter to see the breakdown across all squads at once.

The Date Filter allows you to view data for specific time periods. You can filter for the last month, quarter, or 365 days. If you need more granular control, you can filter by a custom date range.
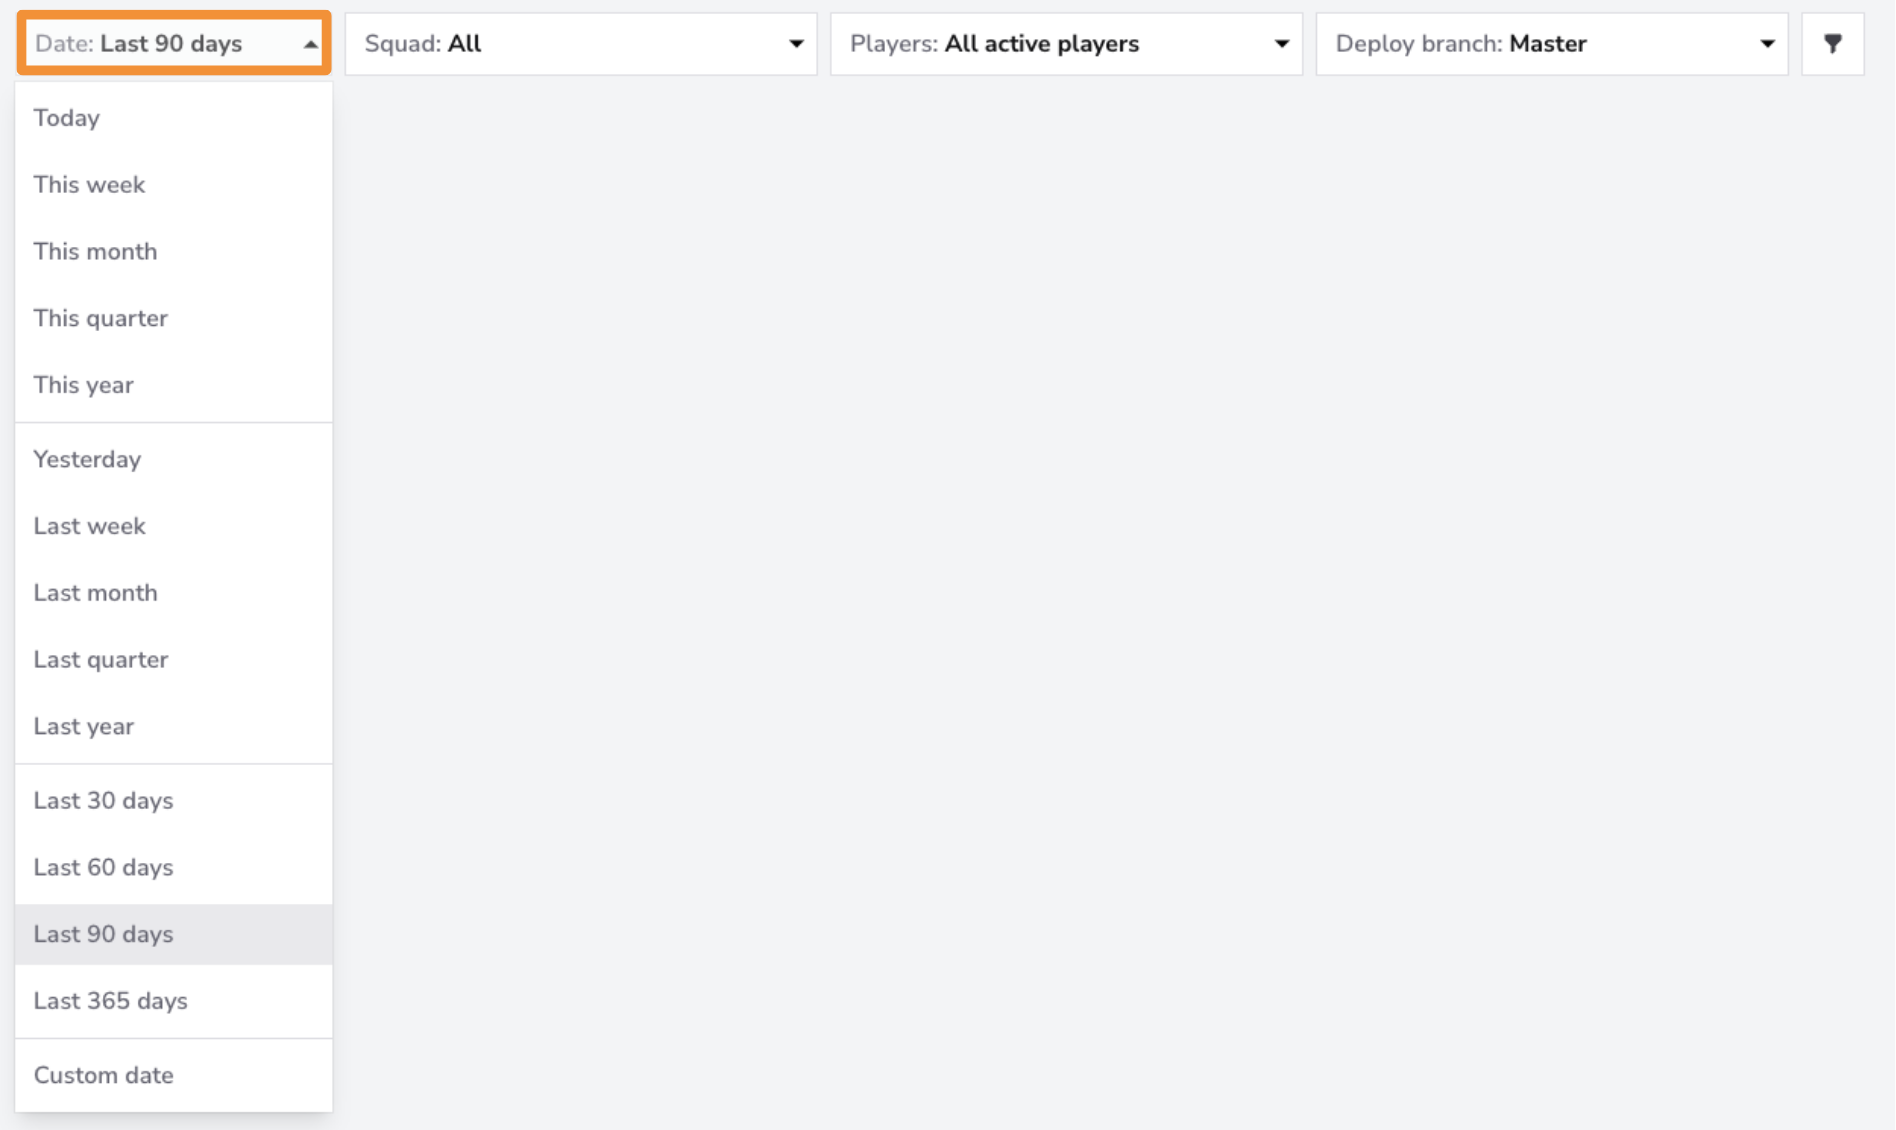
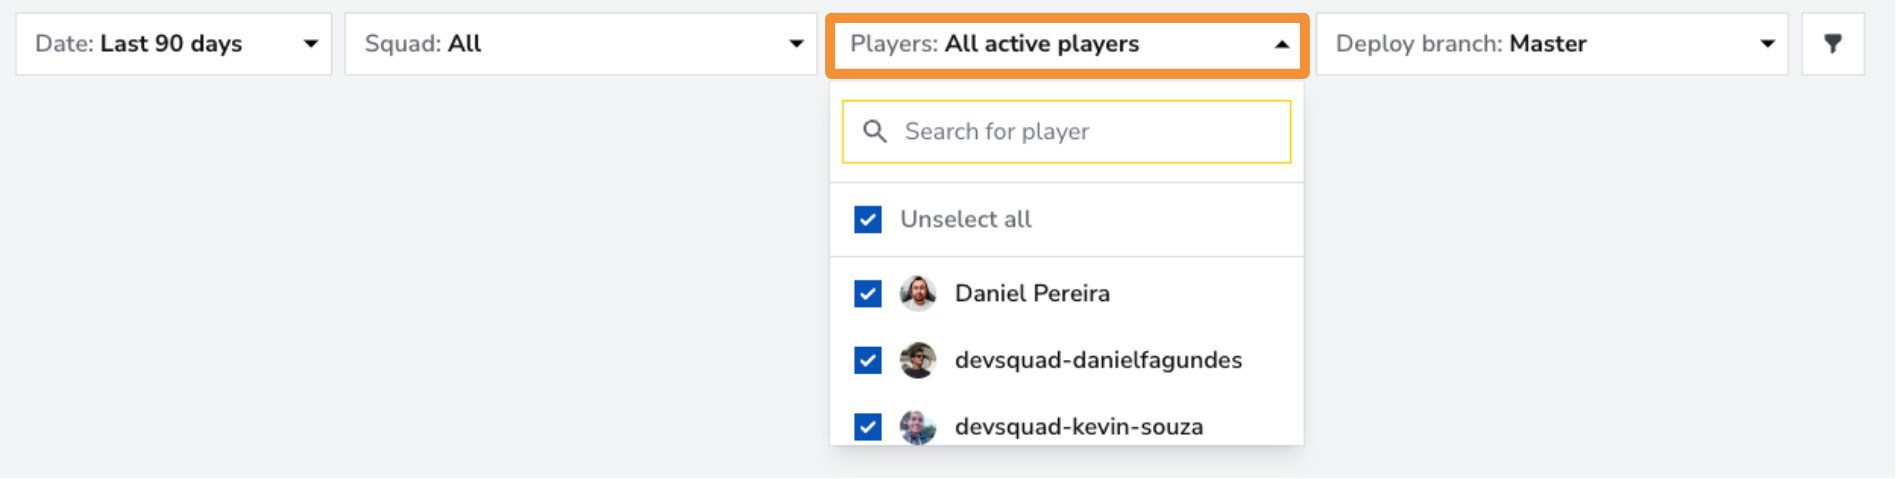
Use the Players Filter to focus on individual team members or a specific group within your squad. You can select one member for a detailed view, a group of team members if they form a sub-squad, or all team members for an overview of the entire squad's deploy metrics.
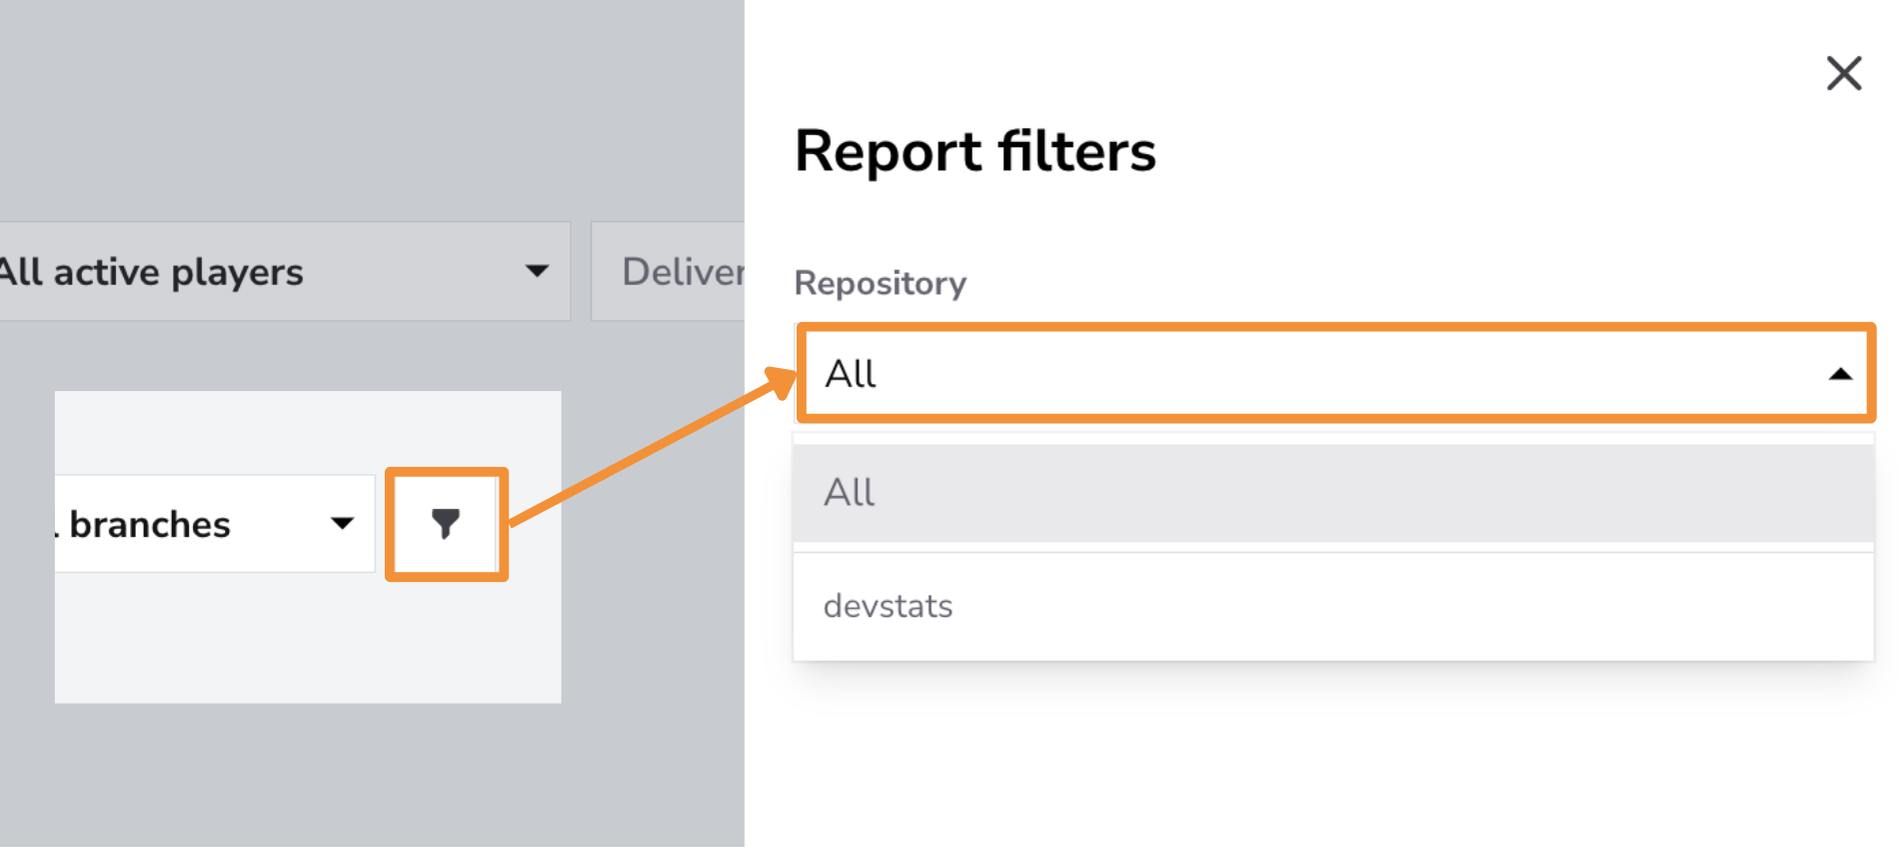
Use the Repository Filter to focus on specific repositories or view deployment metrics across all repositories. This is helpful for isolating deployment patterns and performance in key codebases, especially if your team works across multiple repositories.
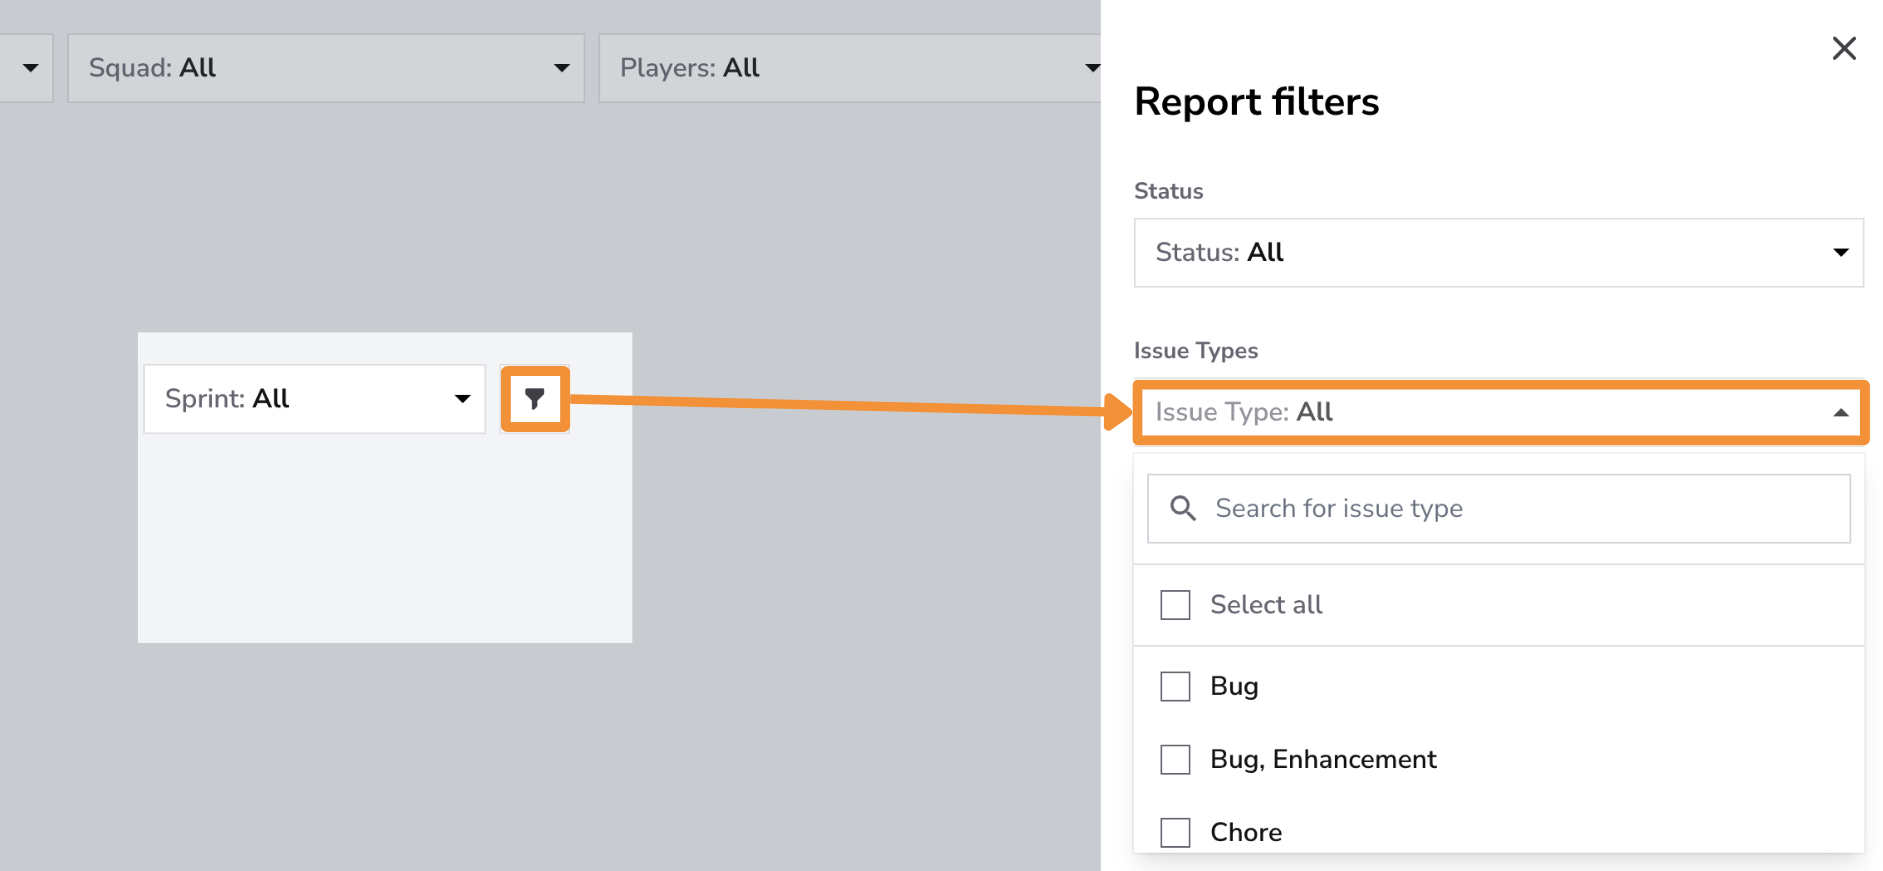
Use the Issue Type Filter to narrow down data by issue types, such as Features, Bugs, Enhancements, or Hotfixes. Useful for tracking how quickly critical issues like hotfixes and bugs are deployed.
Use the Data Source Filter to refine deploy metrics based on the origin of the data, whether from a Git provider or a project management tool.
- Git provider: Filters deploy metrics sourced from version control systems, such as code commits and pull requests.
- Project management: Filters deploy metrics sourced from project management tools.
Controls
Select the Deploys Frequency in Days card to open Controls and choose Average, Mode, or Percentile. This card offers Statistical Measure only, without Chart Settings or PR Cycle Time Stages. Controls is not shown for the deploy count or Change Failure Rate cards.
Click the adjustments button on the Controls bar and select Save after choosing your options. See the Controls guide for details.
Explore Best Practices
Conclusion
The Deploy Dashboard is a valuable tool for tracking and optimizing your team's deployment process. By monitoring deployment frequency and change failure rate, teams can ensure a reliable release process that delivers value to users quickly and consistently.