What is the Aging Issues Feature?
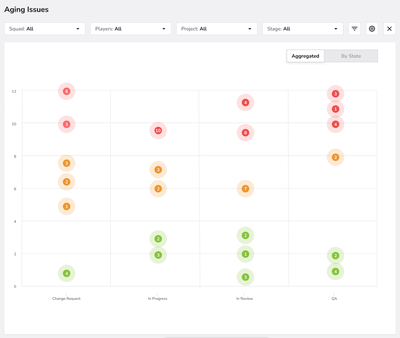
The Aging Issues Metric offers a visual overview of how long tasks have been in different stages of the workflow, helping teams spot delays, identify bottlenecks, and prioritize tasks that need immediate attention.
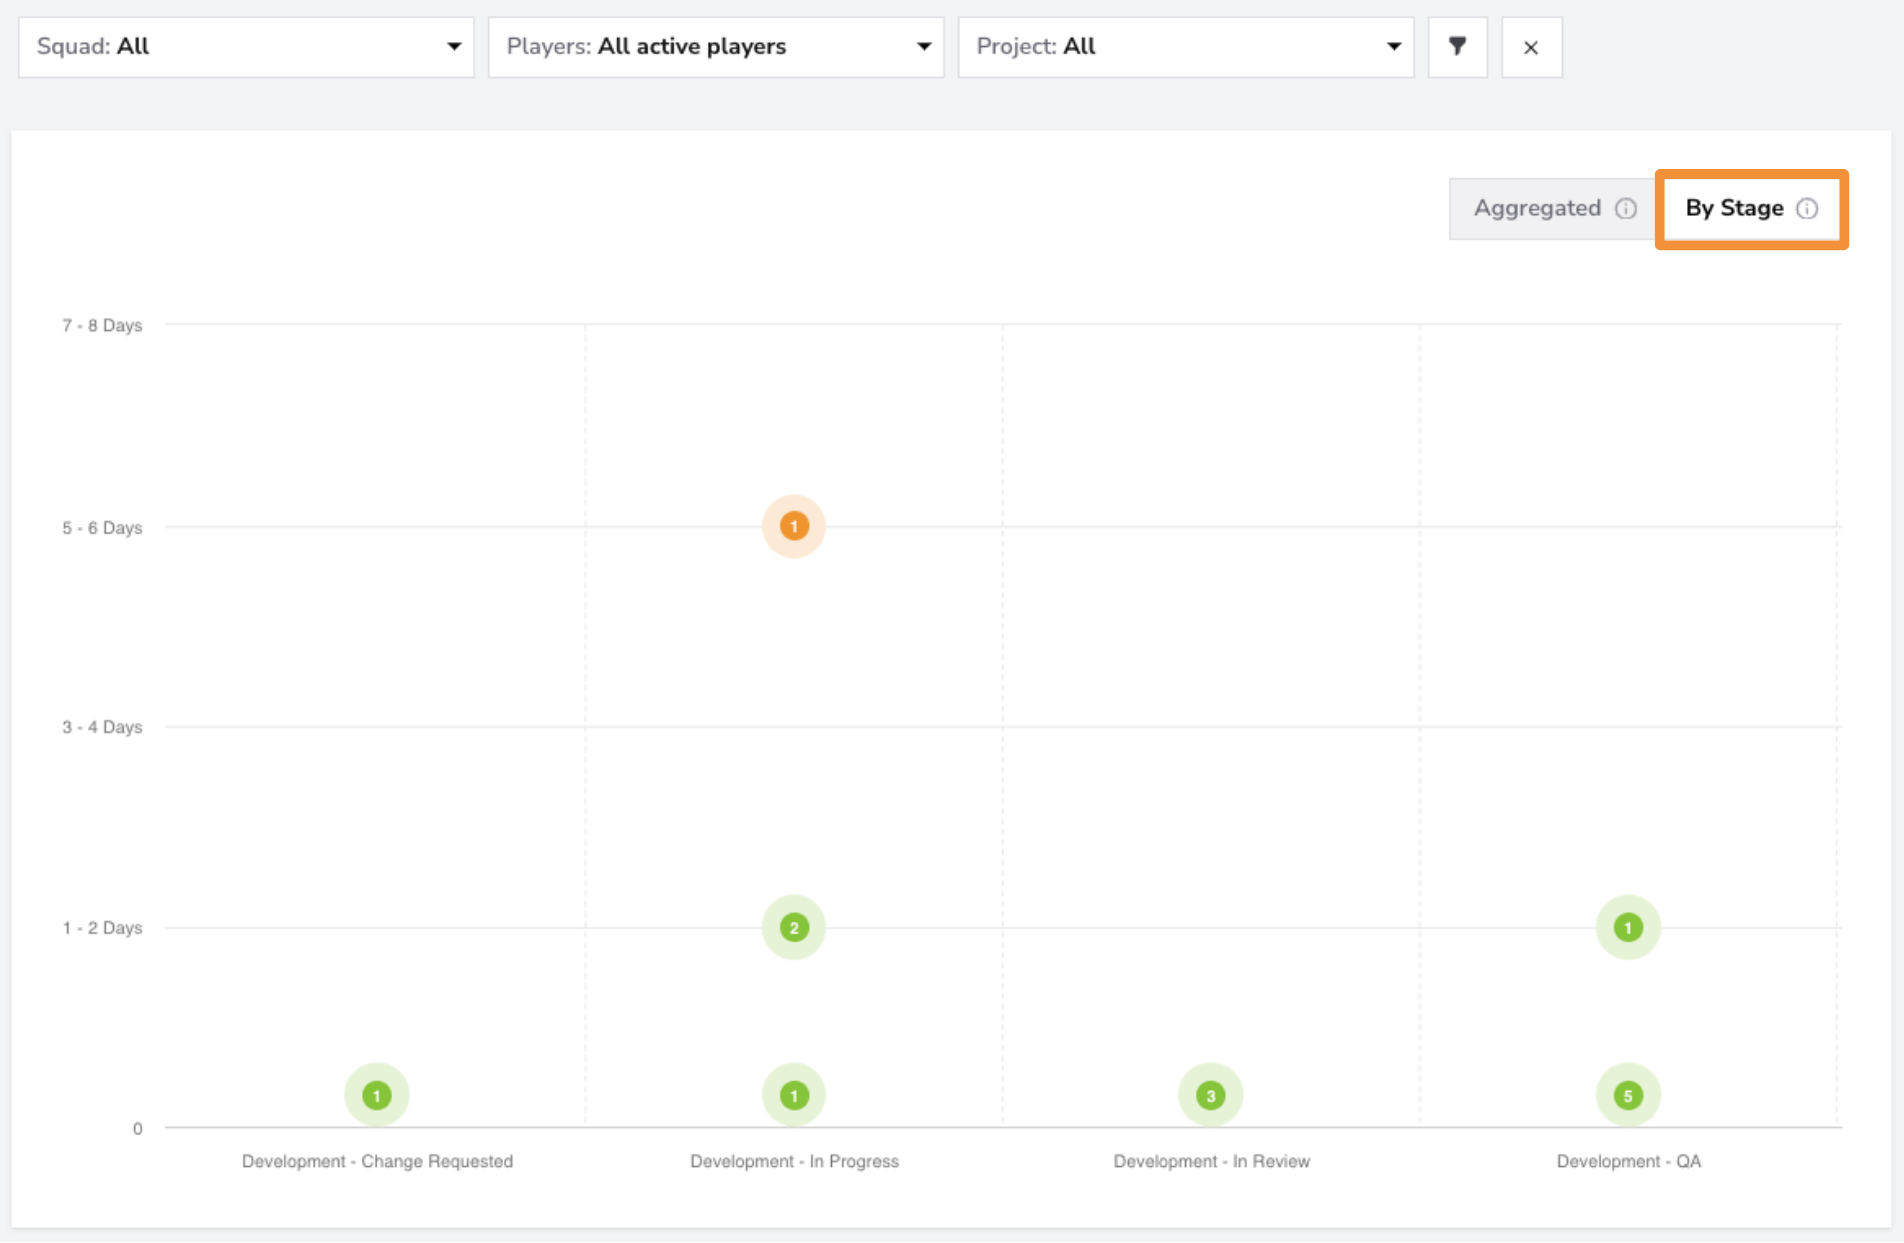
By tracking tasks as they progress through stages like "Change Request," "In Progress," "In Review," and "QA," this metric provides a clear view of workflow health. Dots on the chart represent tasks, and their position on the vertical axis with color coding—green, yellow, and red—indicates how long each task has remained in its current stage (or across the workflow), allowing teams to address issues promptly and maintain a balanced workflow. The position on the horizontal axis always indicates the current stage of the task.
Metrics
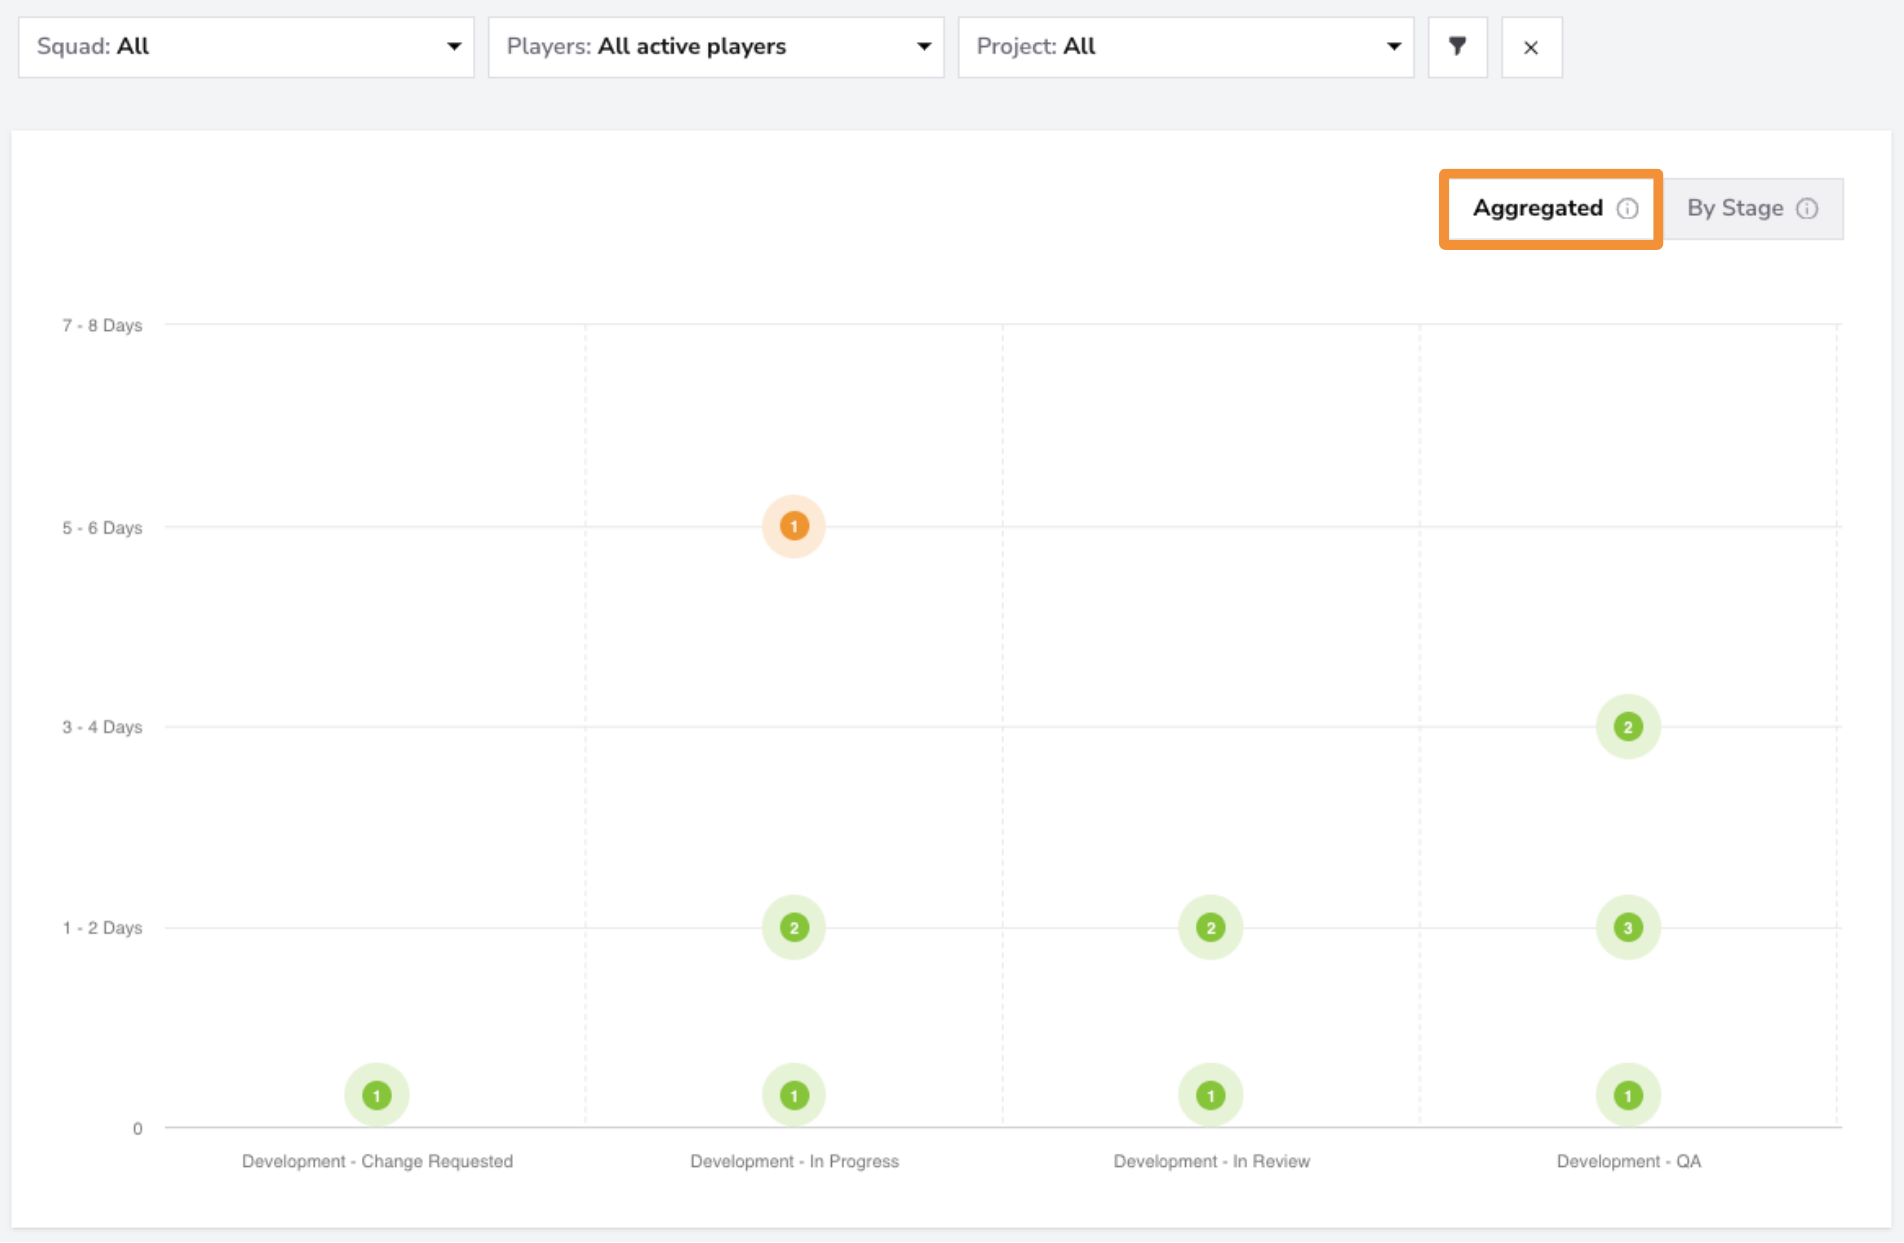
There are two key metrics: Task Aging by Stage, which tracks time spent only in the current workflow stage, and Aggregated Task Aging, which provides an overall view of task progression across the workflow.
Task Aging by Stage
- What: Task Aging by Stage tracks the time individual tasks spend in the current workflow stage (e.g., "Change Request," "In Progress," "In Review," "QA"), helping teams see where delays may occur.
- Why it matters: By understanding how long tasks typically remain in each stage and across the entire process, teams can pinpoint problem areas and take steps to optimize resources, improve processes, or prioritize specific tasks.
- How to use it: The chart shows the aging of individual tasks in each of their current stages, with color-coded dots (green, yellow, red) indicating how long a task has been in its latest stage.Prioritize tasks with red dots, as they have been in a stage longer than the acceptable threshold, which could slow down the entire workflow.
- User interface:
Issues List
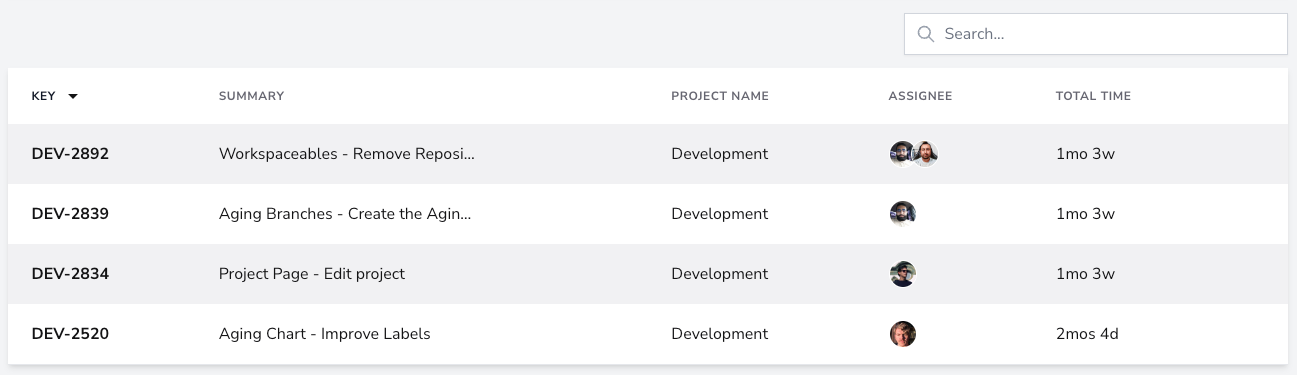
The table provides a detailed breakdown of the issues represented in the Aging Issues Metric. It includes the issue key, issue name, project name, assigned user, and the total time across the workflow. This allows teams to complement the chart visualization with precise task-level information for deeper analysis.
Filters
Use the Squad Filter to view task aging data by specific squads, or across all squads. This filter is valuable for analyzing the performance and workflow health of individual squads, helping to identify bottlenecks or delays in specific team processes. By isolating aging metrics per squad, you can prioritize interventions where they’re most needed and ensure consistent progress across teams.
The Players Filter allows you to narrow down task aging data by individual team members or a subset of contributors. This filter helps you assess each contributor's task aging patterns and workload, making it easier to spot individual bottlenecks or identify where additional support may be required. Using this filter, you can ensure that tasks are distributed evenly and that each team member can maintain a healthy workflow pace.
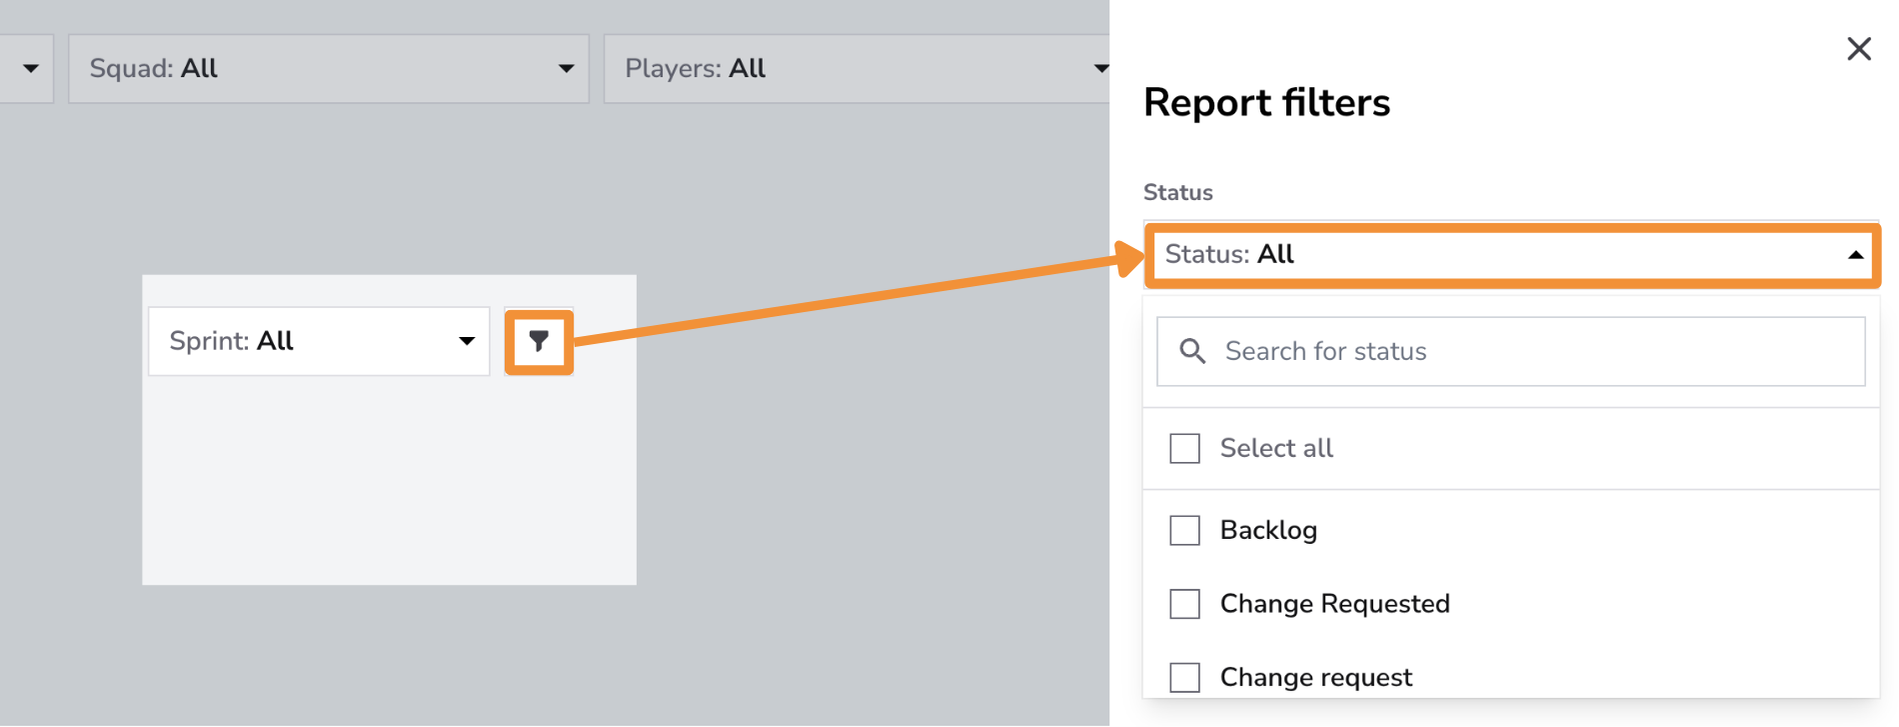
With the Status Filter, you can refine task aging metrics based on workflow stages such as In Progress, In Review, or Change Request. This filter is particularly valuable for analyzing how tasks evolve within specific statuses, helping you uncover delays or inefficiencies tied to certain workflow stages. By focusing on status-based metrics, you can better understand where work tends to slow down, improve process efficiency, and ensure that tasks continue moving smoothly through the pipeline toward completion.
Conclusion
The Aging Issues Metric is essential for maintaining a smooth and efficient workflow. By visually tracking how long tasks remain in each stage, this metric enables teams to identify bottlenecks, prioritize aging tasks, and adjust resources or processes as needed.