What is the DORA Snapshot Feature?
The DORA Snapshot Feature provides a comprehensive view of your team's software delivery performance by tracking four key metrics: PR Cycle Time, Deploy Frequency, Change Failure Rate, and Mean Time to Recovery (MTTR). These are industry benchmarks for evaluating the efficiency, reliability, and overall health of your software delivery pipeline.
To ensure accurate CFR and MTTR calculations, configure how DevStats detects incidents. By default, DevStats uses branch prefixes like
hotfix/andbugfix/. For more precise tracking, you can also log incidents via the Incident Management UI or submit them via the Incidents API.
👉 Learn how to submit deployment data to DevStats
How It Works
DORA tracks four metrics that together reflect the speed and stability of your software delivery pipeline.
| Metric | What it measures |
|---|---|
| Deploy Frequency | How often code is deployed to production |
| PR Cycle Time | Total time from first commit to deployment across five stages: Coding, Pickup, Review, Merge and Deploy |
| Change Failure Rate | Percentage of deployments that required remediation in production |
| MTTR | Average time to recover from a production incident |
Deploy Frequency
Average number of days between deployments across all integrated repositories. See Deploy for details on how deployments are tracked.
PR Cycle Time
Same calculation as the standalone PR Cycle Time metric. See PR Cycle Time for details on how each stage is measured.
Change Failure Rate
Calculated as: (Remediation Deployments / Total Deployments) x 100
DevStats detects remediation deployments (deployments that required remediation in production) through three methods that can be used together:
| Method | How it works |
|---|---|
| Branch prefix | Automatically detects branches with prefixes like hotfix/ or bugfix/ |
| Incident Management UI | Incidents logged manually via the DevStats Incident Management feature |
| API | Incidents submitted via the Incidents API from an external tool |
MTTR
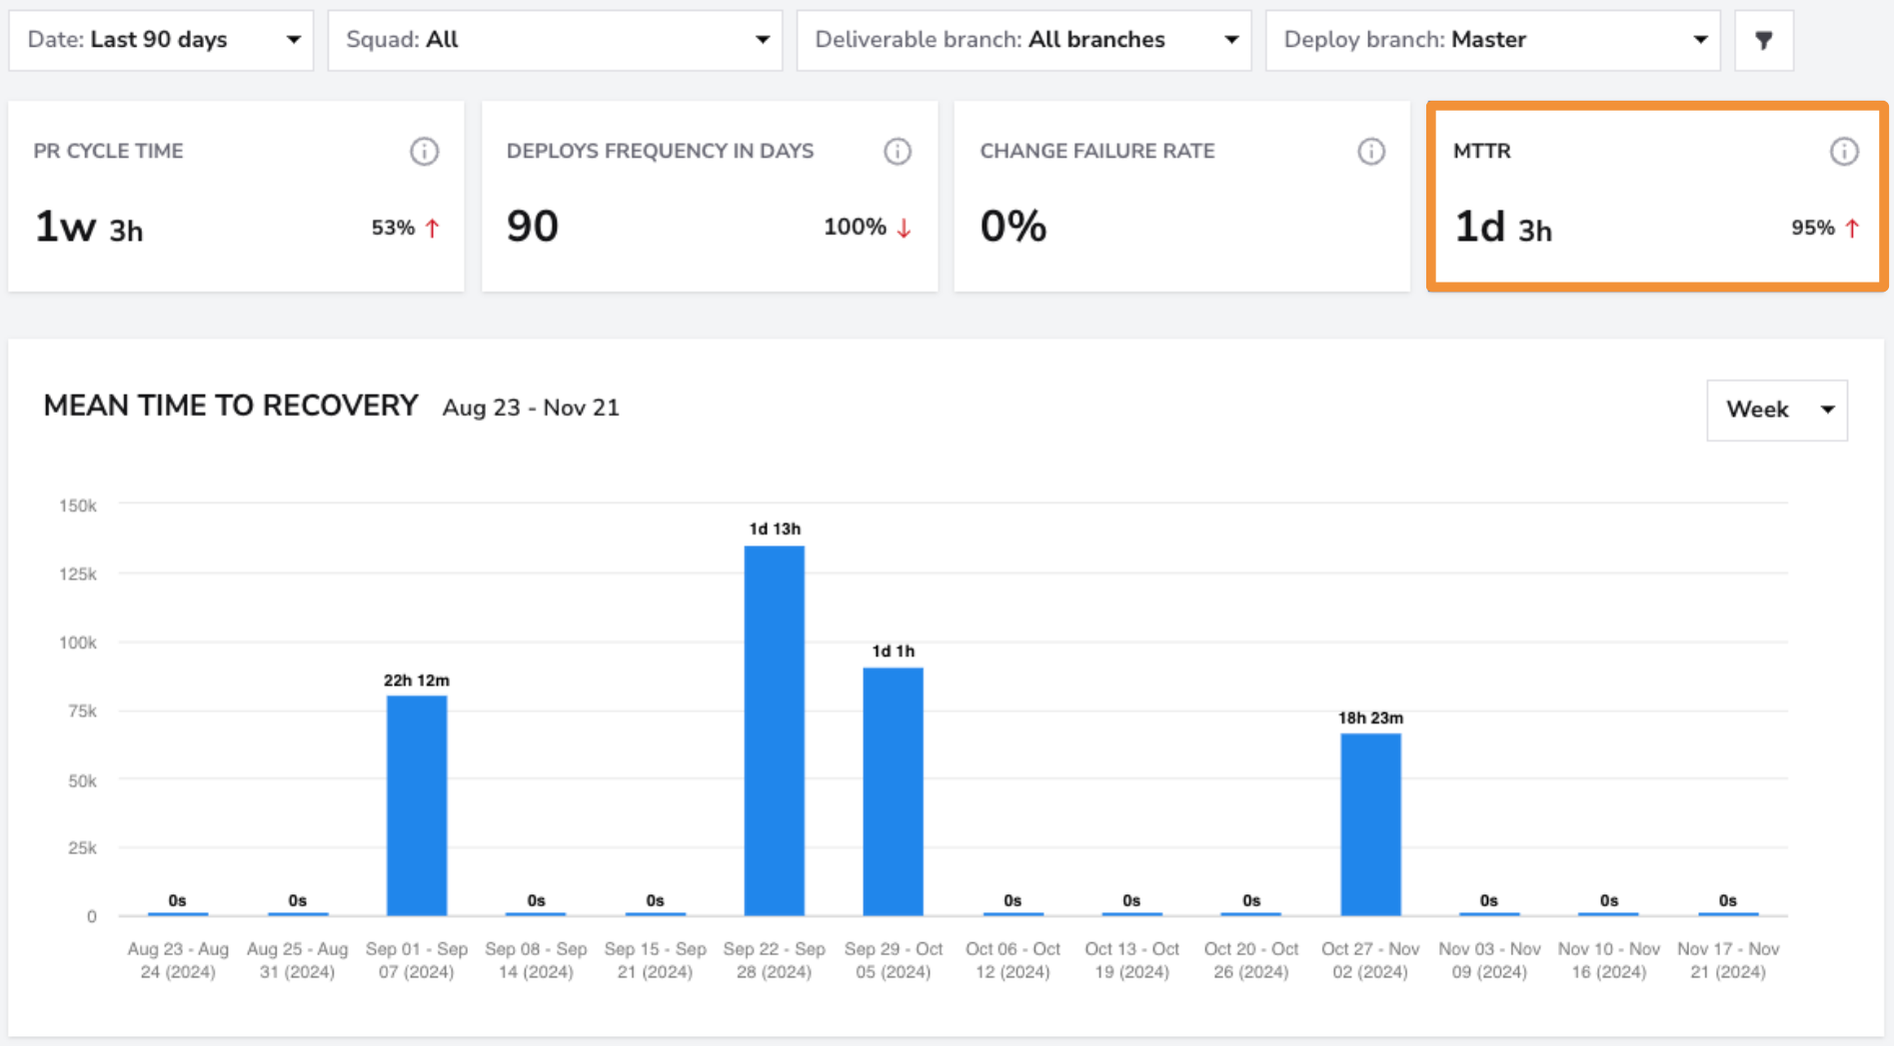
MTTR is calculated as the average of resolved_at - started_at across all resolved incidents. Incidents with no resolution date are excluded until resolved. See Incidents for full details on how incidents are tracked and how this calculation works.
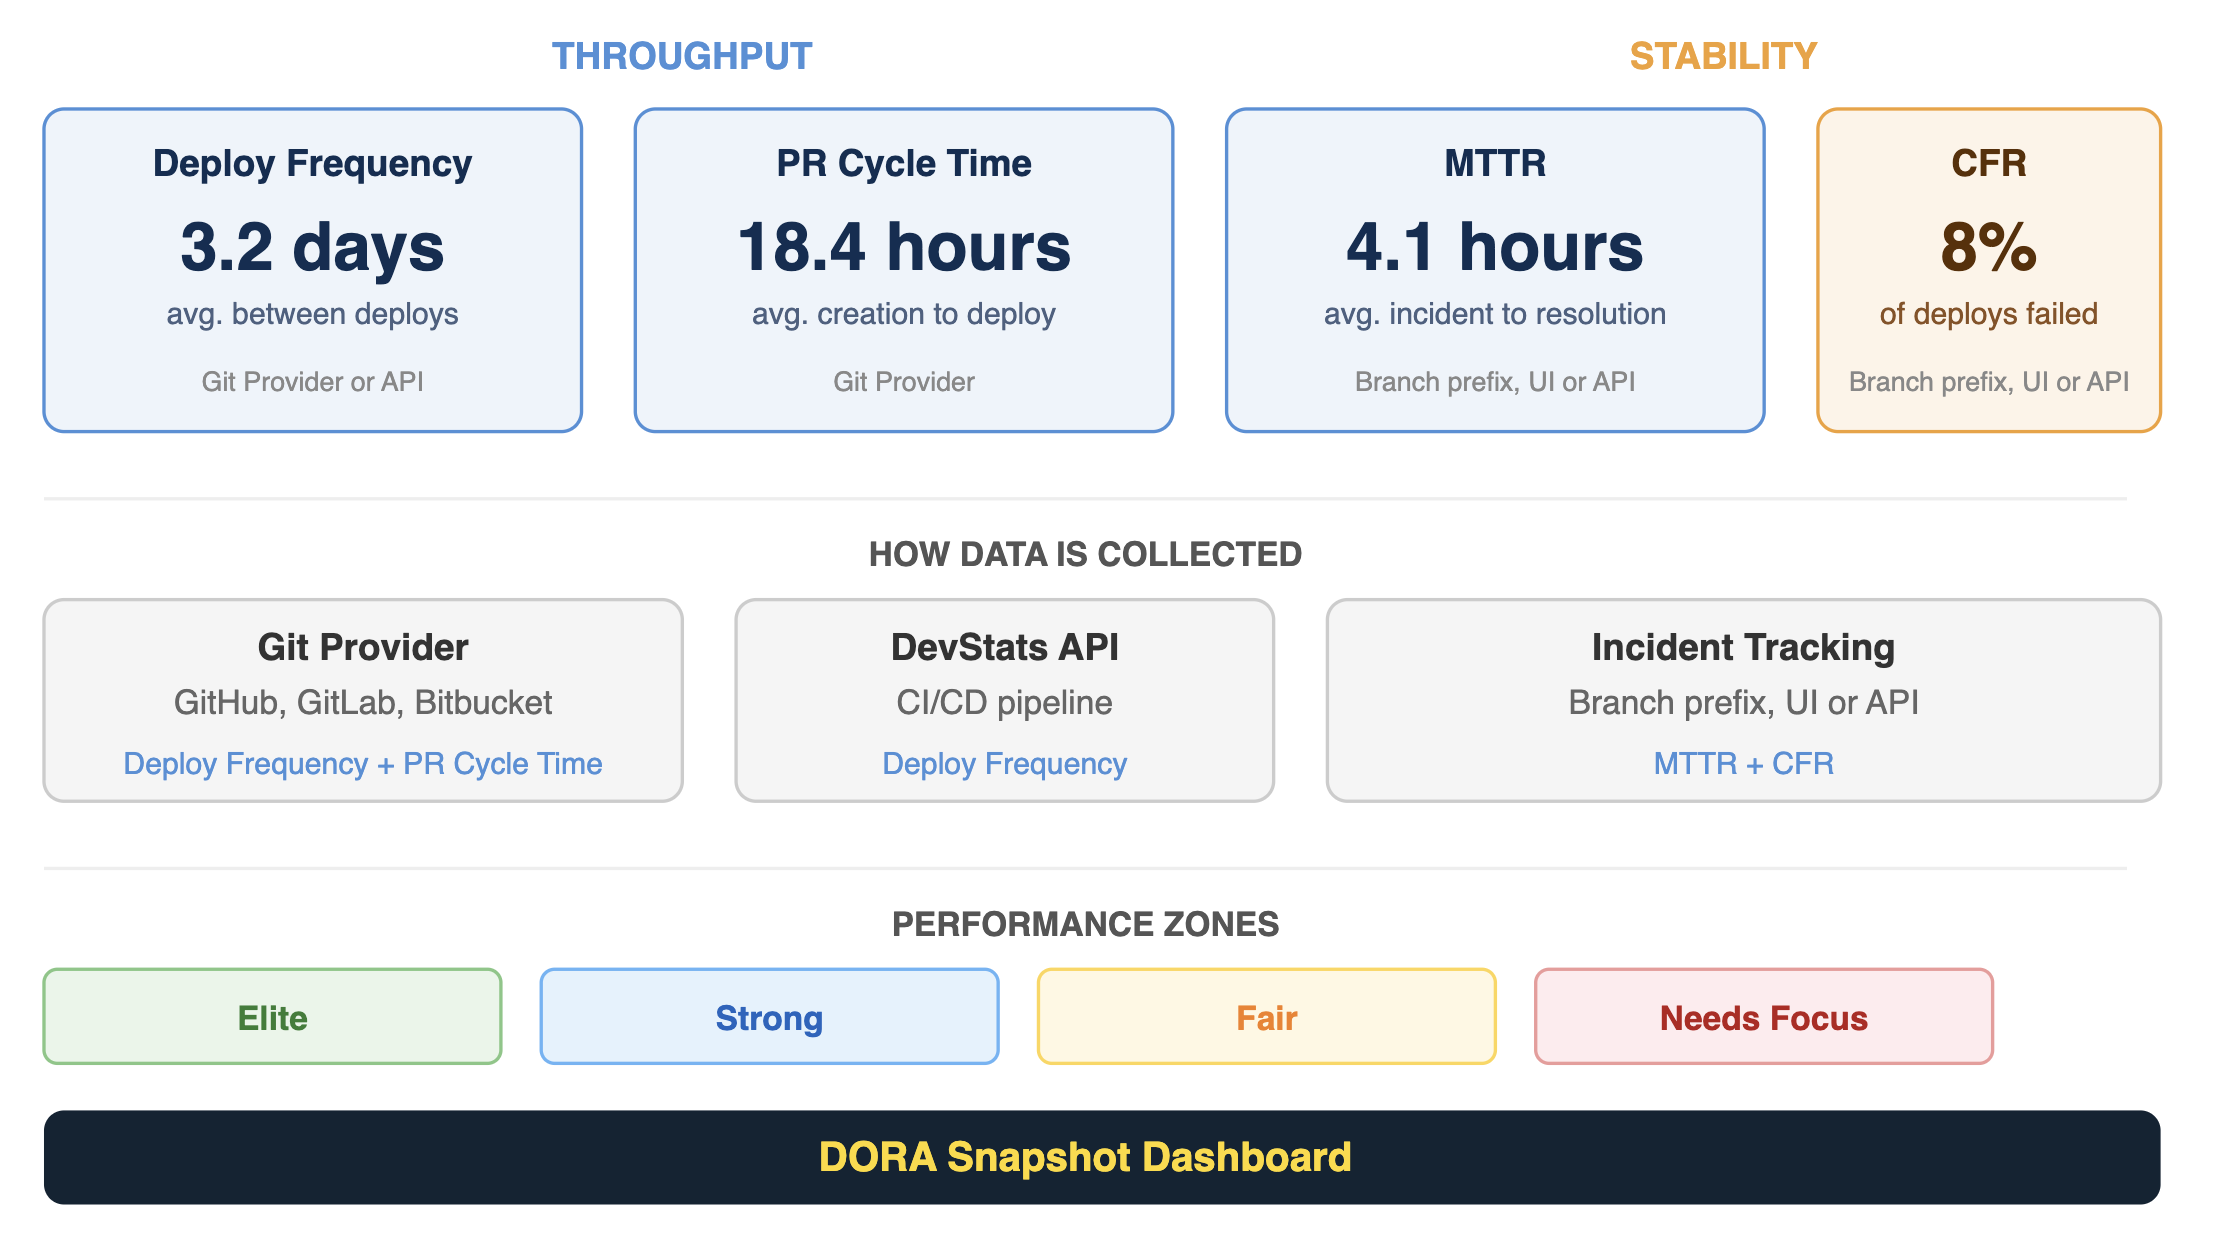
Deploy Frequency and PR Cycle Time are tracked automatically via your Git provider. Deploy Frequency can also be submitted via the DevStats API from your CI/CD pipeline. MTTR and Change Failure Rate both rely on incident tracking, which can be configured via branch prefix detection, Incident Management UI, or Incidents API.
Metrics
PR Cycle Time
- What: Total time from first commit to production deploy.
- How to use it: Shorter cycle times mean faster delivery. Identify bottlenecks in the PR lifecycle and streamline review and deployment stages.
- User interface:
Deploy Frequency in Days
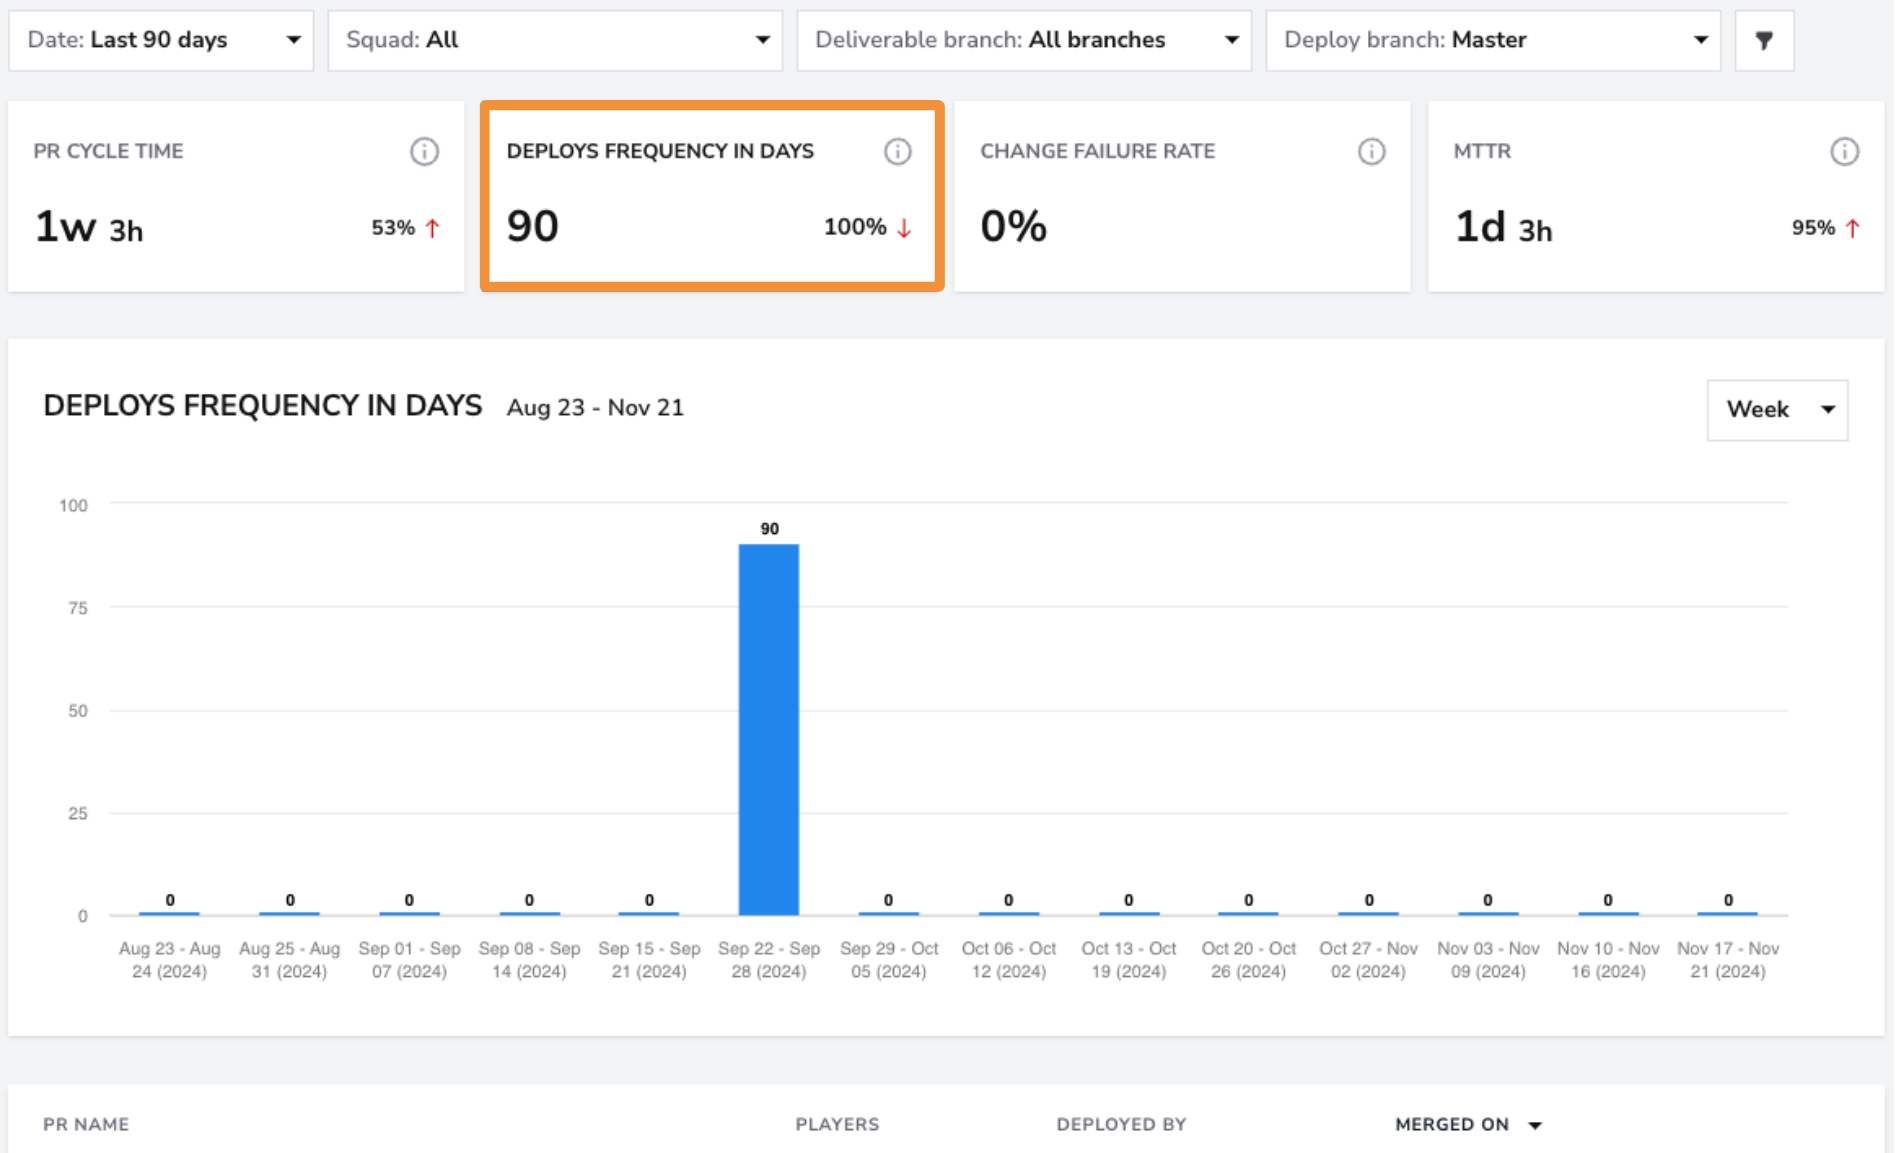
- What: Average number of days between deployments across all integrated repositories.
- How to use it: A lower value means more frequent deployments. Aim for smaller, incremental updates to reduce risk and accelerate delivery.
- User interface:
Change Failure Rate
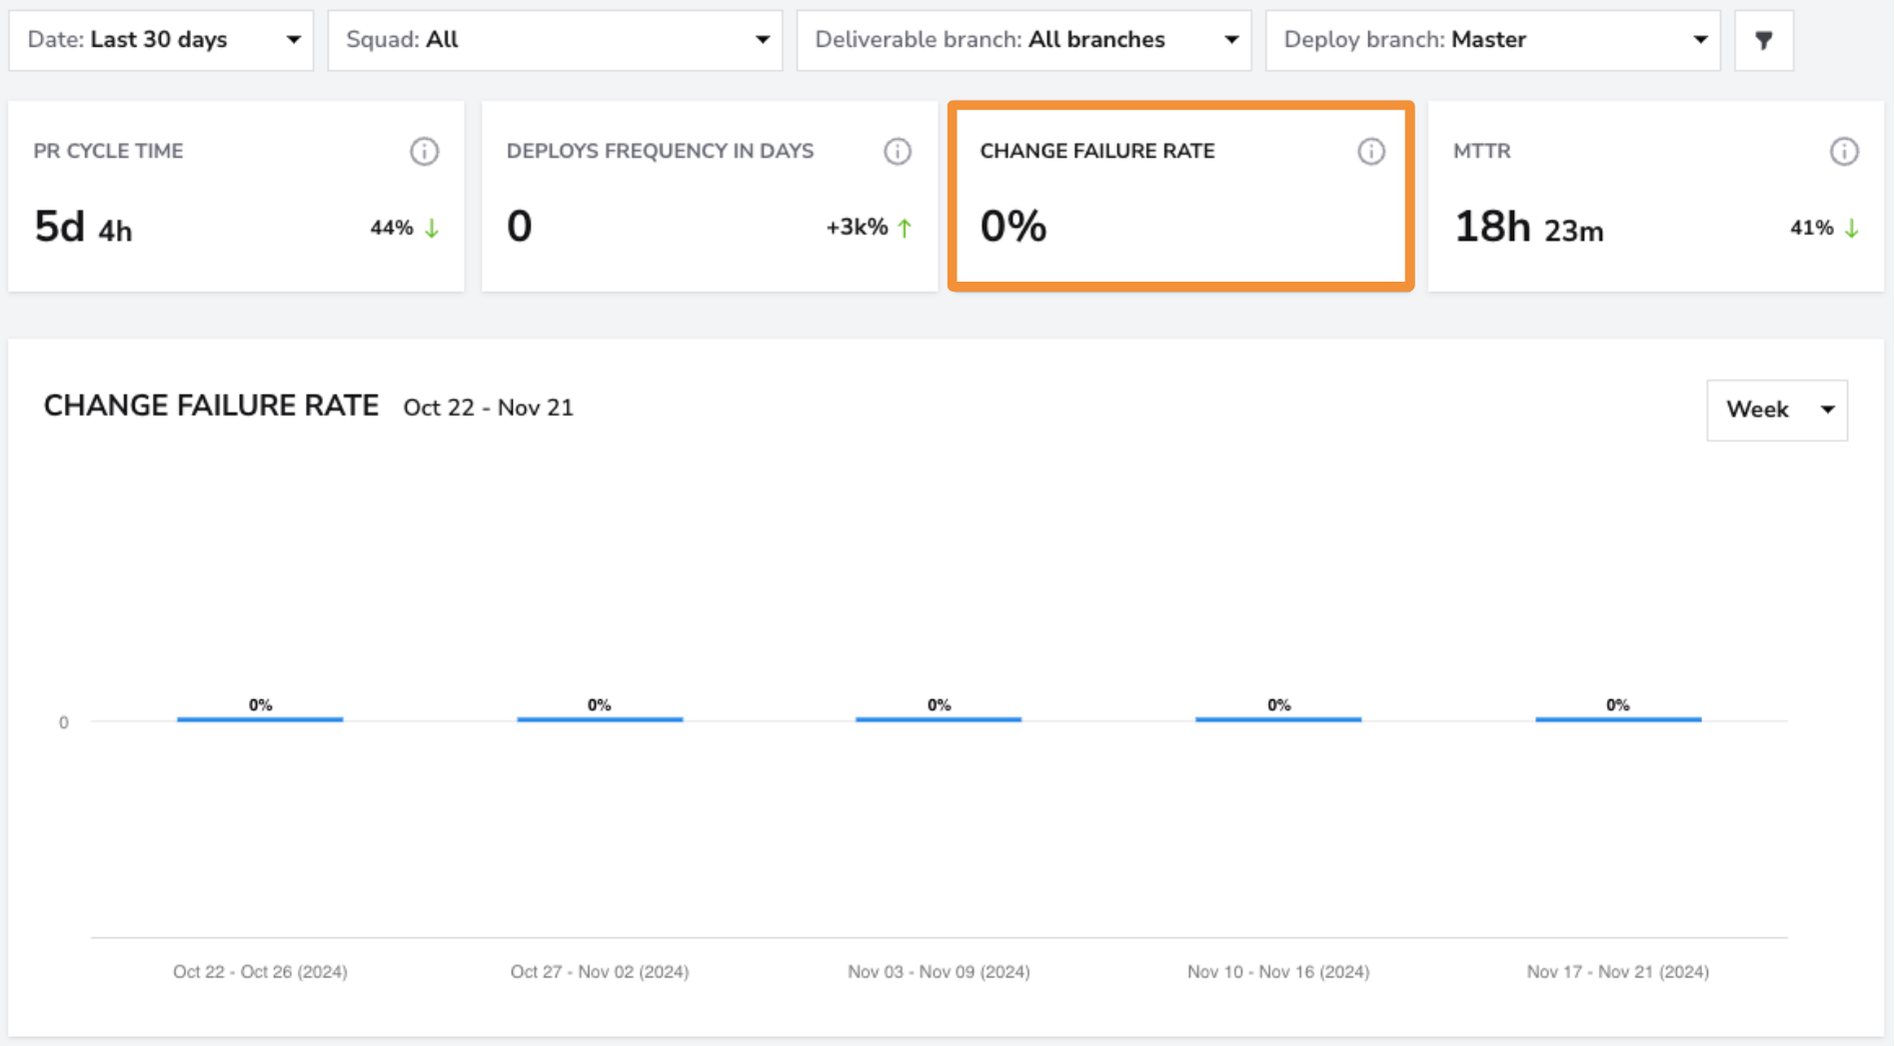
- What: Percentage of deployments that required remediation in production.
- How to use it: A high rate points to insufficient testing or integration issues. Investigate root causes and implement quality checks to bring this down.
- User interface:
Filters
Use the Squad Filter to view DORA metrics for individual squads. If you want a broader overview of all teams, select the "All" filter to see the breakdown across all squads at once.
The Date Filter allows you to view data for specific time periods. You can filter for the last month, quarter, or 365 days. If you need more granular control, you can filter by a custom date range.
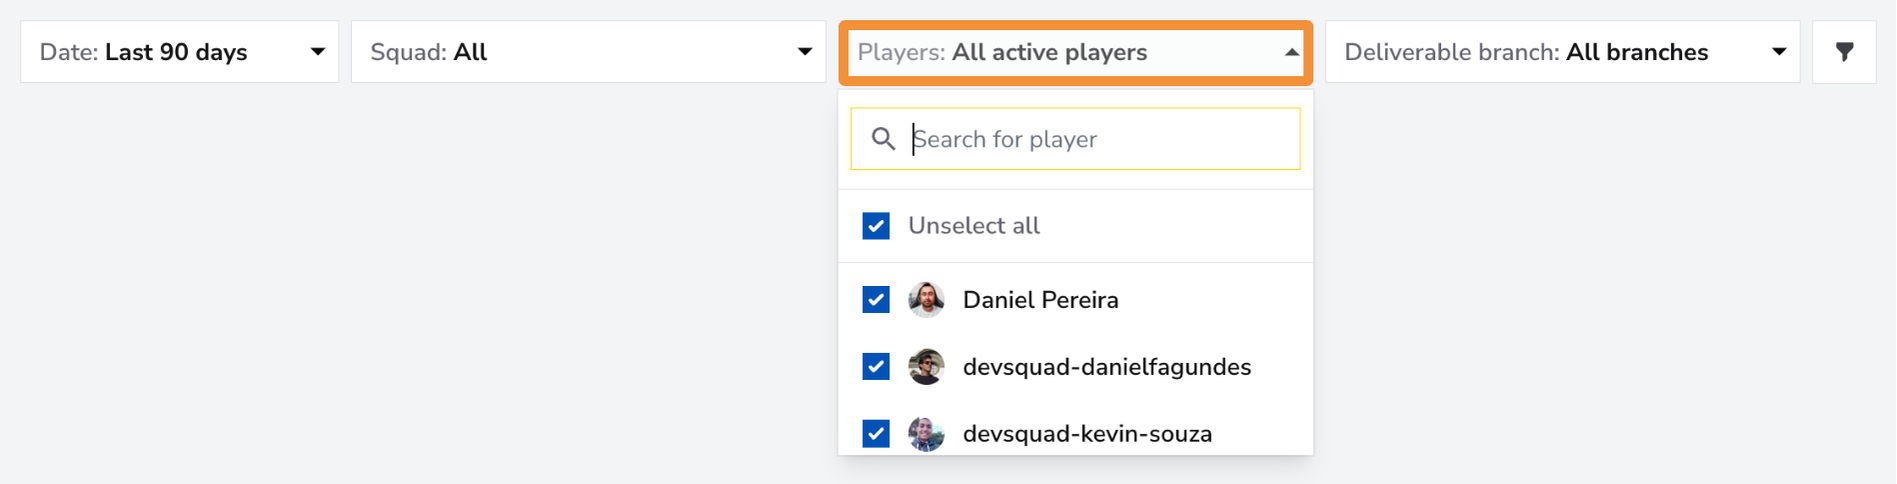
Use the Players Filter to focus on individual team members or a specific group within your squad. You can select one member for a detailed view, a group of team members if they form a sub-squad, or all team members for an overview of the entire squad's DORA metrics.
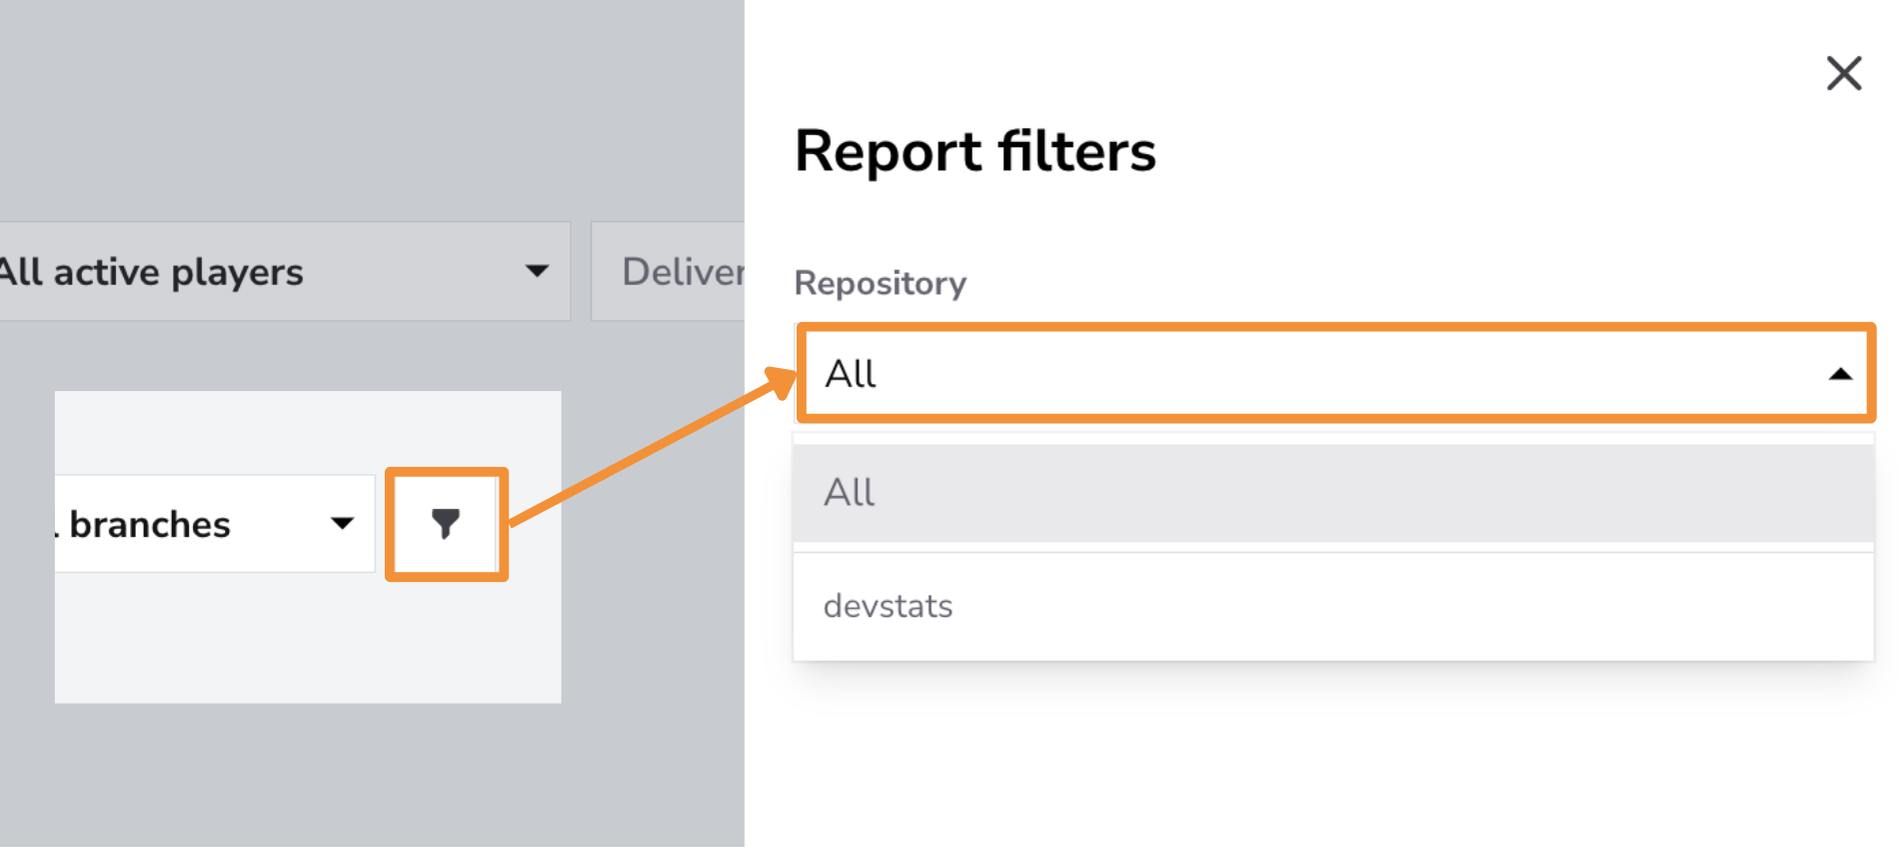
Use the Repository Filter to focus on specific repositories or view DORA metrics across all repositories.
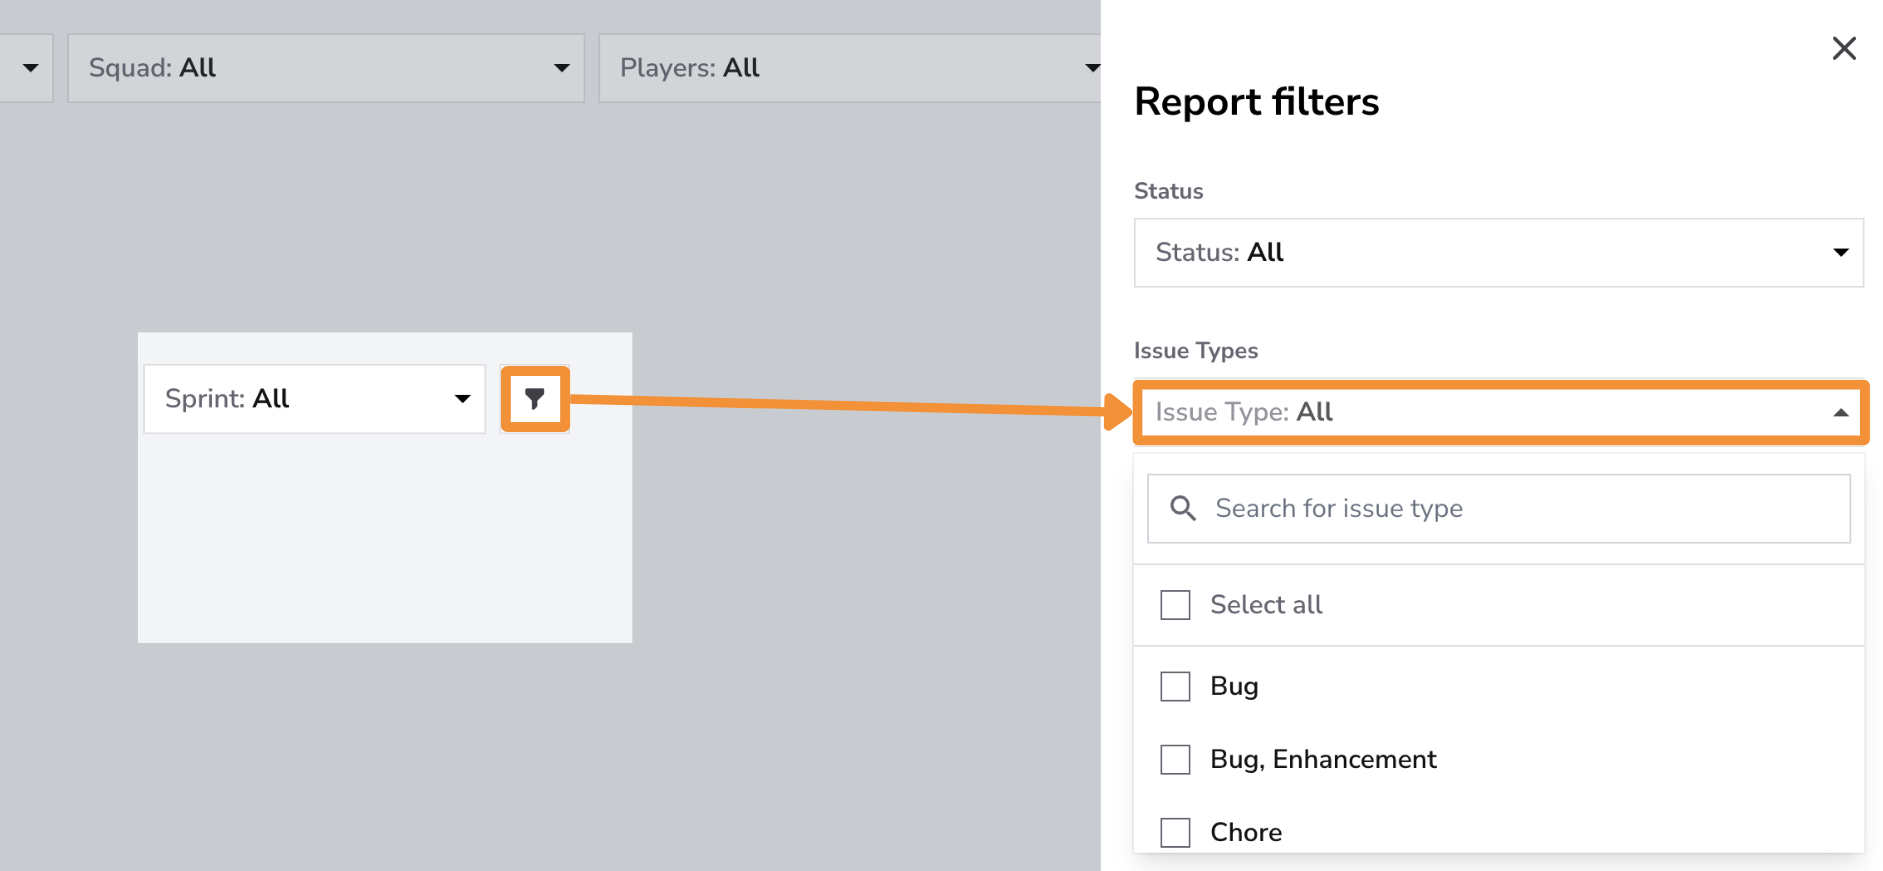
Use the Issue Type Filter to analyze DORA Metrics for specific issue types, such as Features, Bugs, Enhancements, or Hotfixes, or view metrics across all issue types.
Use the Data Source Filter to refine DORA metrics based on the data's origin, whether from a Git provider or a project management tool.
- Git provider: Filters deploy metrics sourced from version control systems, such as code commits and pull requests.
- Project management: Filters deploy metrics sourced from project management tools.
Controls
The options in Controls follow the selected card:
- PR Cycle Time: Statistical Measure, Chart Settings, and PR Cycle Time Stages.
- Mean Time to Recovery and Deploys Frequency in Days: Statistical Measure only.
- Change Failure Rate: Controls is not shown.
Statistical Measure offers Average, Mode, and Percentile. Chart Settings offers Trendline and Regression line. For PR Cycle Time, keep at least two stages selected; Mode uses all five stages and disables stage selection.
Click the adjustments button on the Controls bar and select Save after choosing your options. See the Controls guide for details.
Conclusion
The DORA Metrics Dashboard is an invaluable tool for improving software delivery performance. By regularly monitoring PR Cycle Time, Deploy Frequency, Change Failure Rate, and MTTR, teams can identify inefficiencies, reduce risks, and streamline their development workflows.