Welcome to DevStats. This guide walks you through everything you need to get your first insights up and running: from creating your squad to exploring your dashboards.
✅ Prerequisites
Before you begin, make sure you have:
- An account with a supported Git provider: GitHub, GitLab, GitLab Self-Managed, Bitbucket, Bitbucket Data Center, or Azure Repos.
- Access to a repository with some development activity: the more history available, the richer your dashboards will be.
- Permissions to authenticate DevStats with your chosen platforms.
Step 1: Sign Up
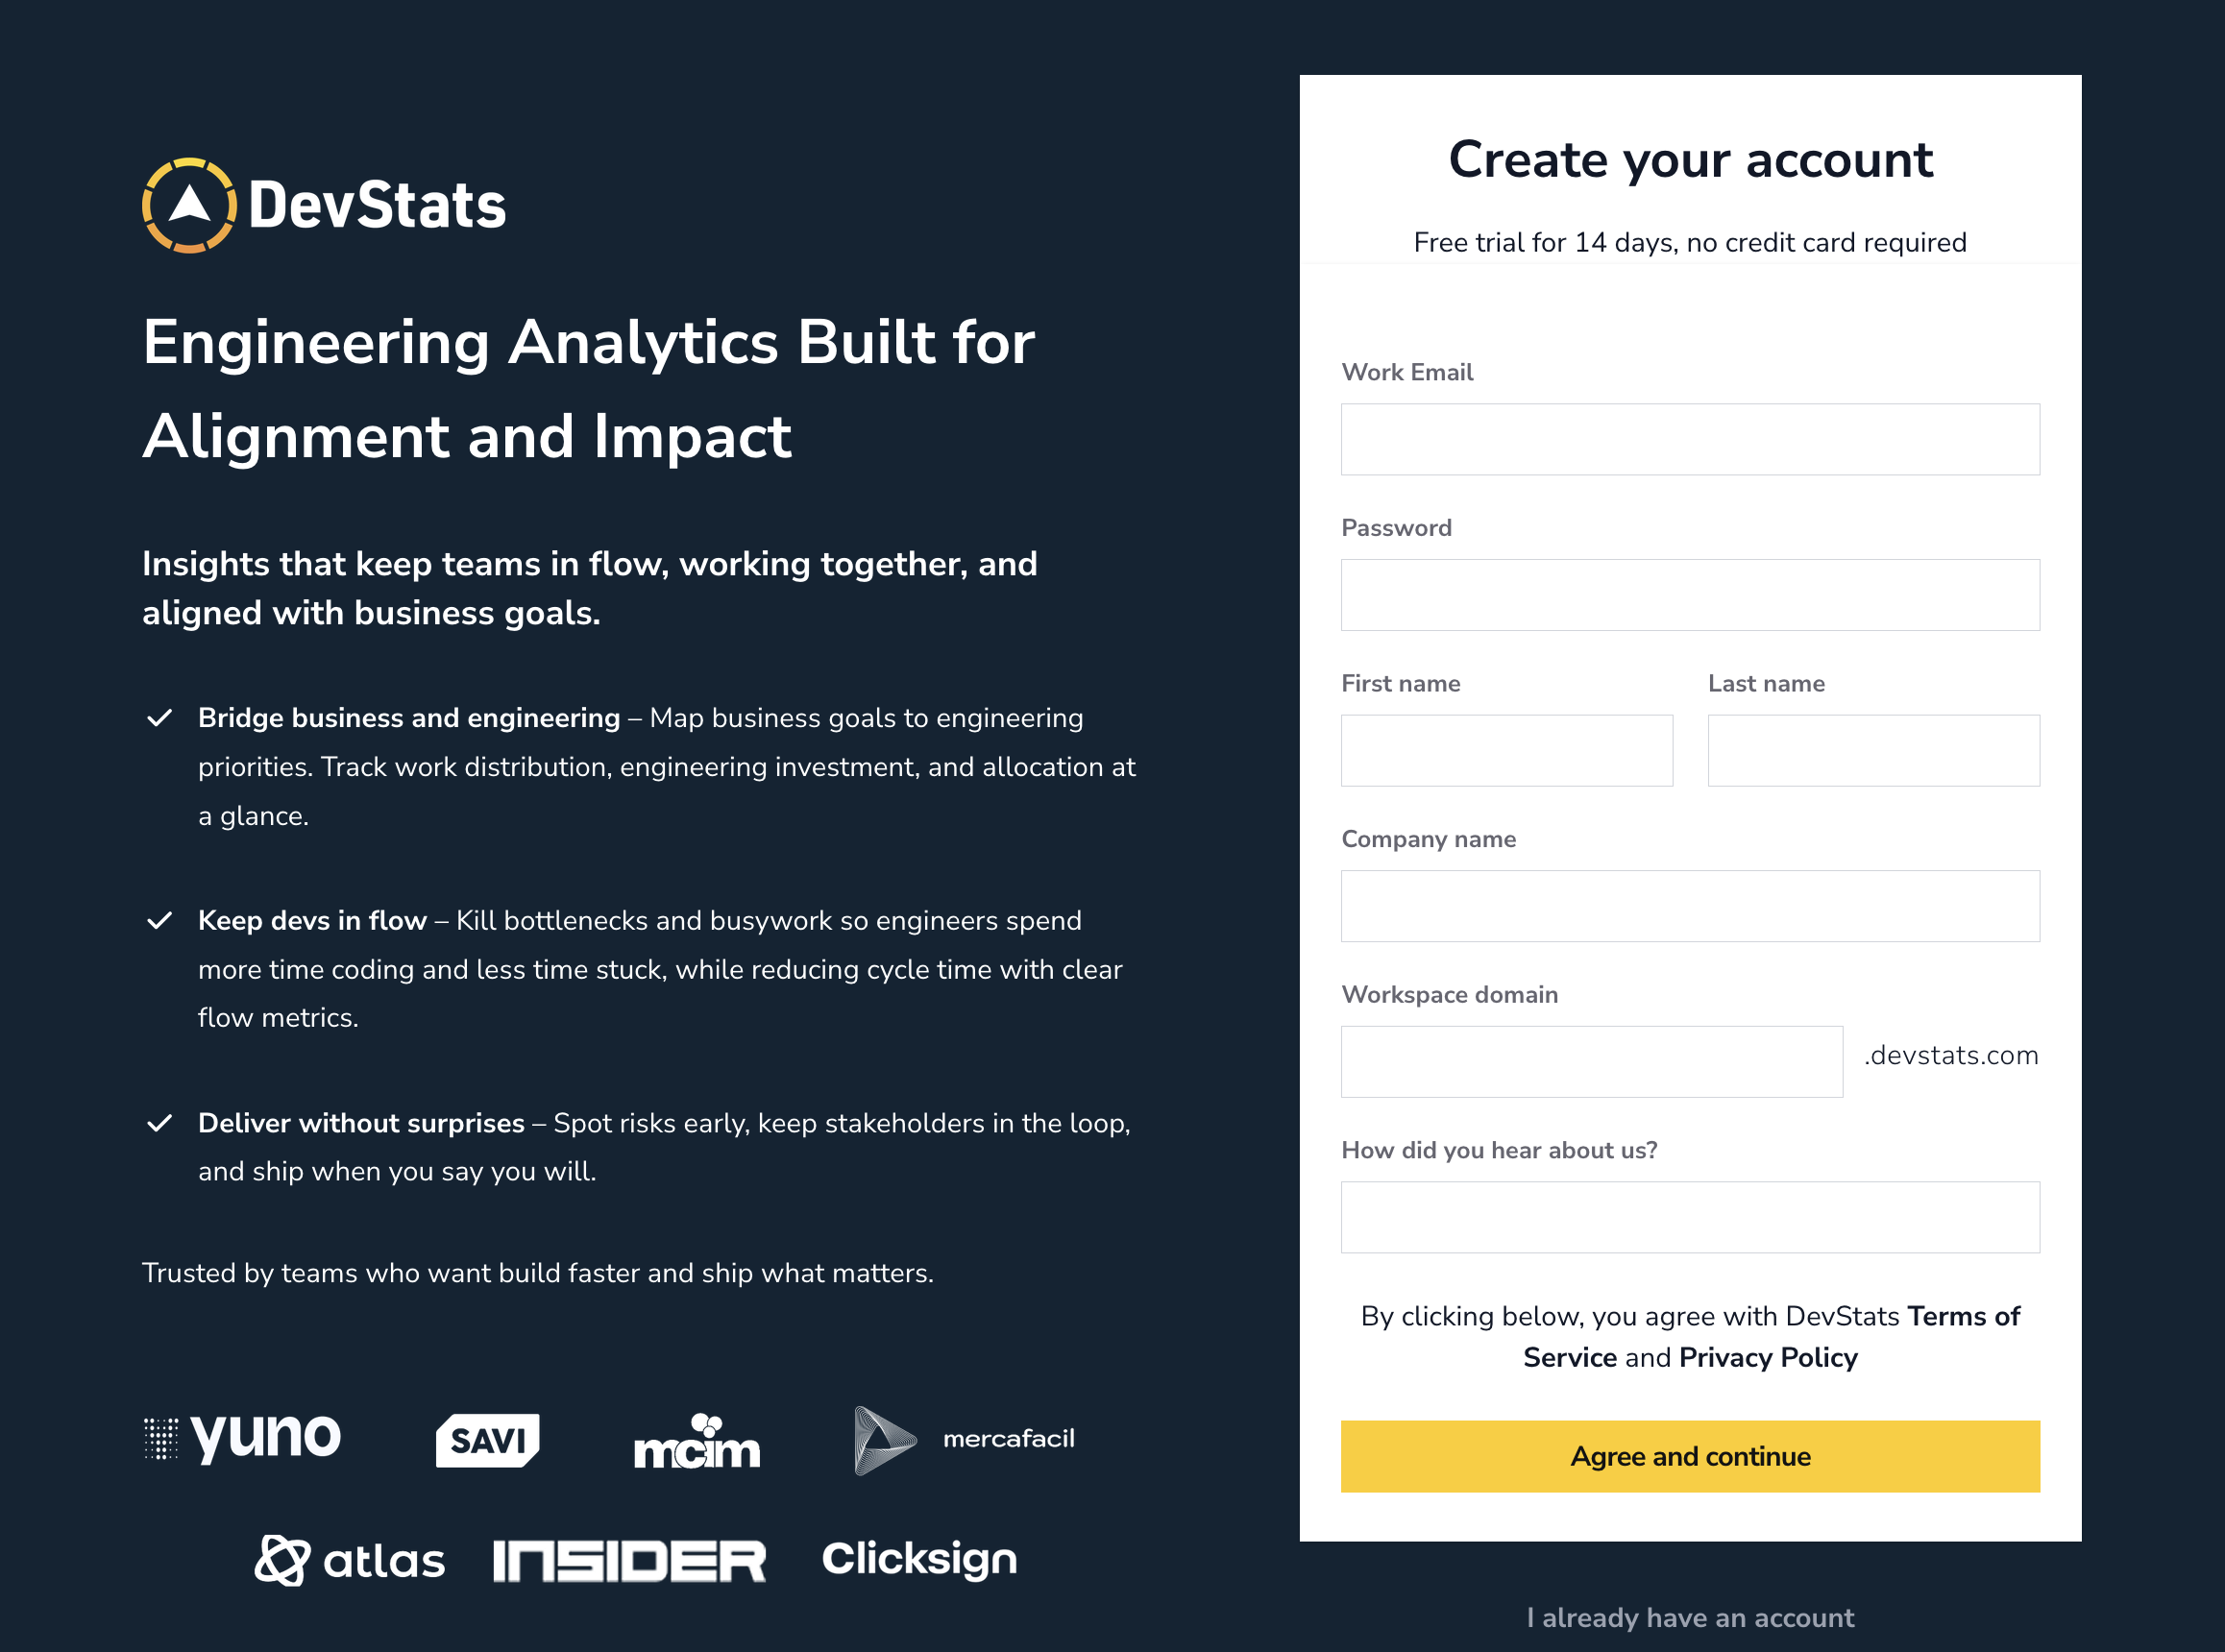
Create your DevStats account by visiting the DevStats homepage and clicking Sign Up. Follow the prompts to register and verify your account.
Step 2: Create Your First Squad
A Squad is the core unit in DevStats. It represents your development team (or a subset of it) and defines which developers and repositories are tracked.
To create a squad:
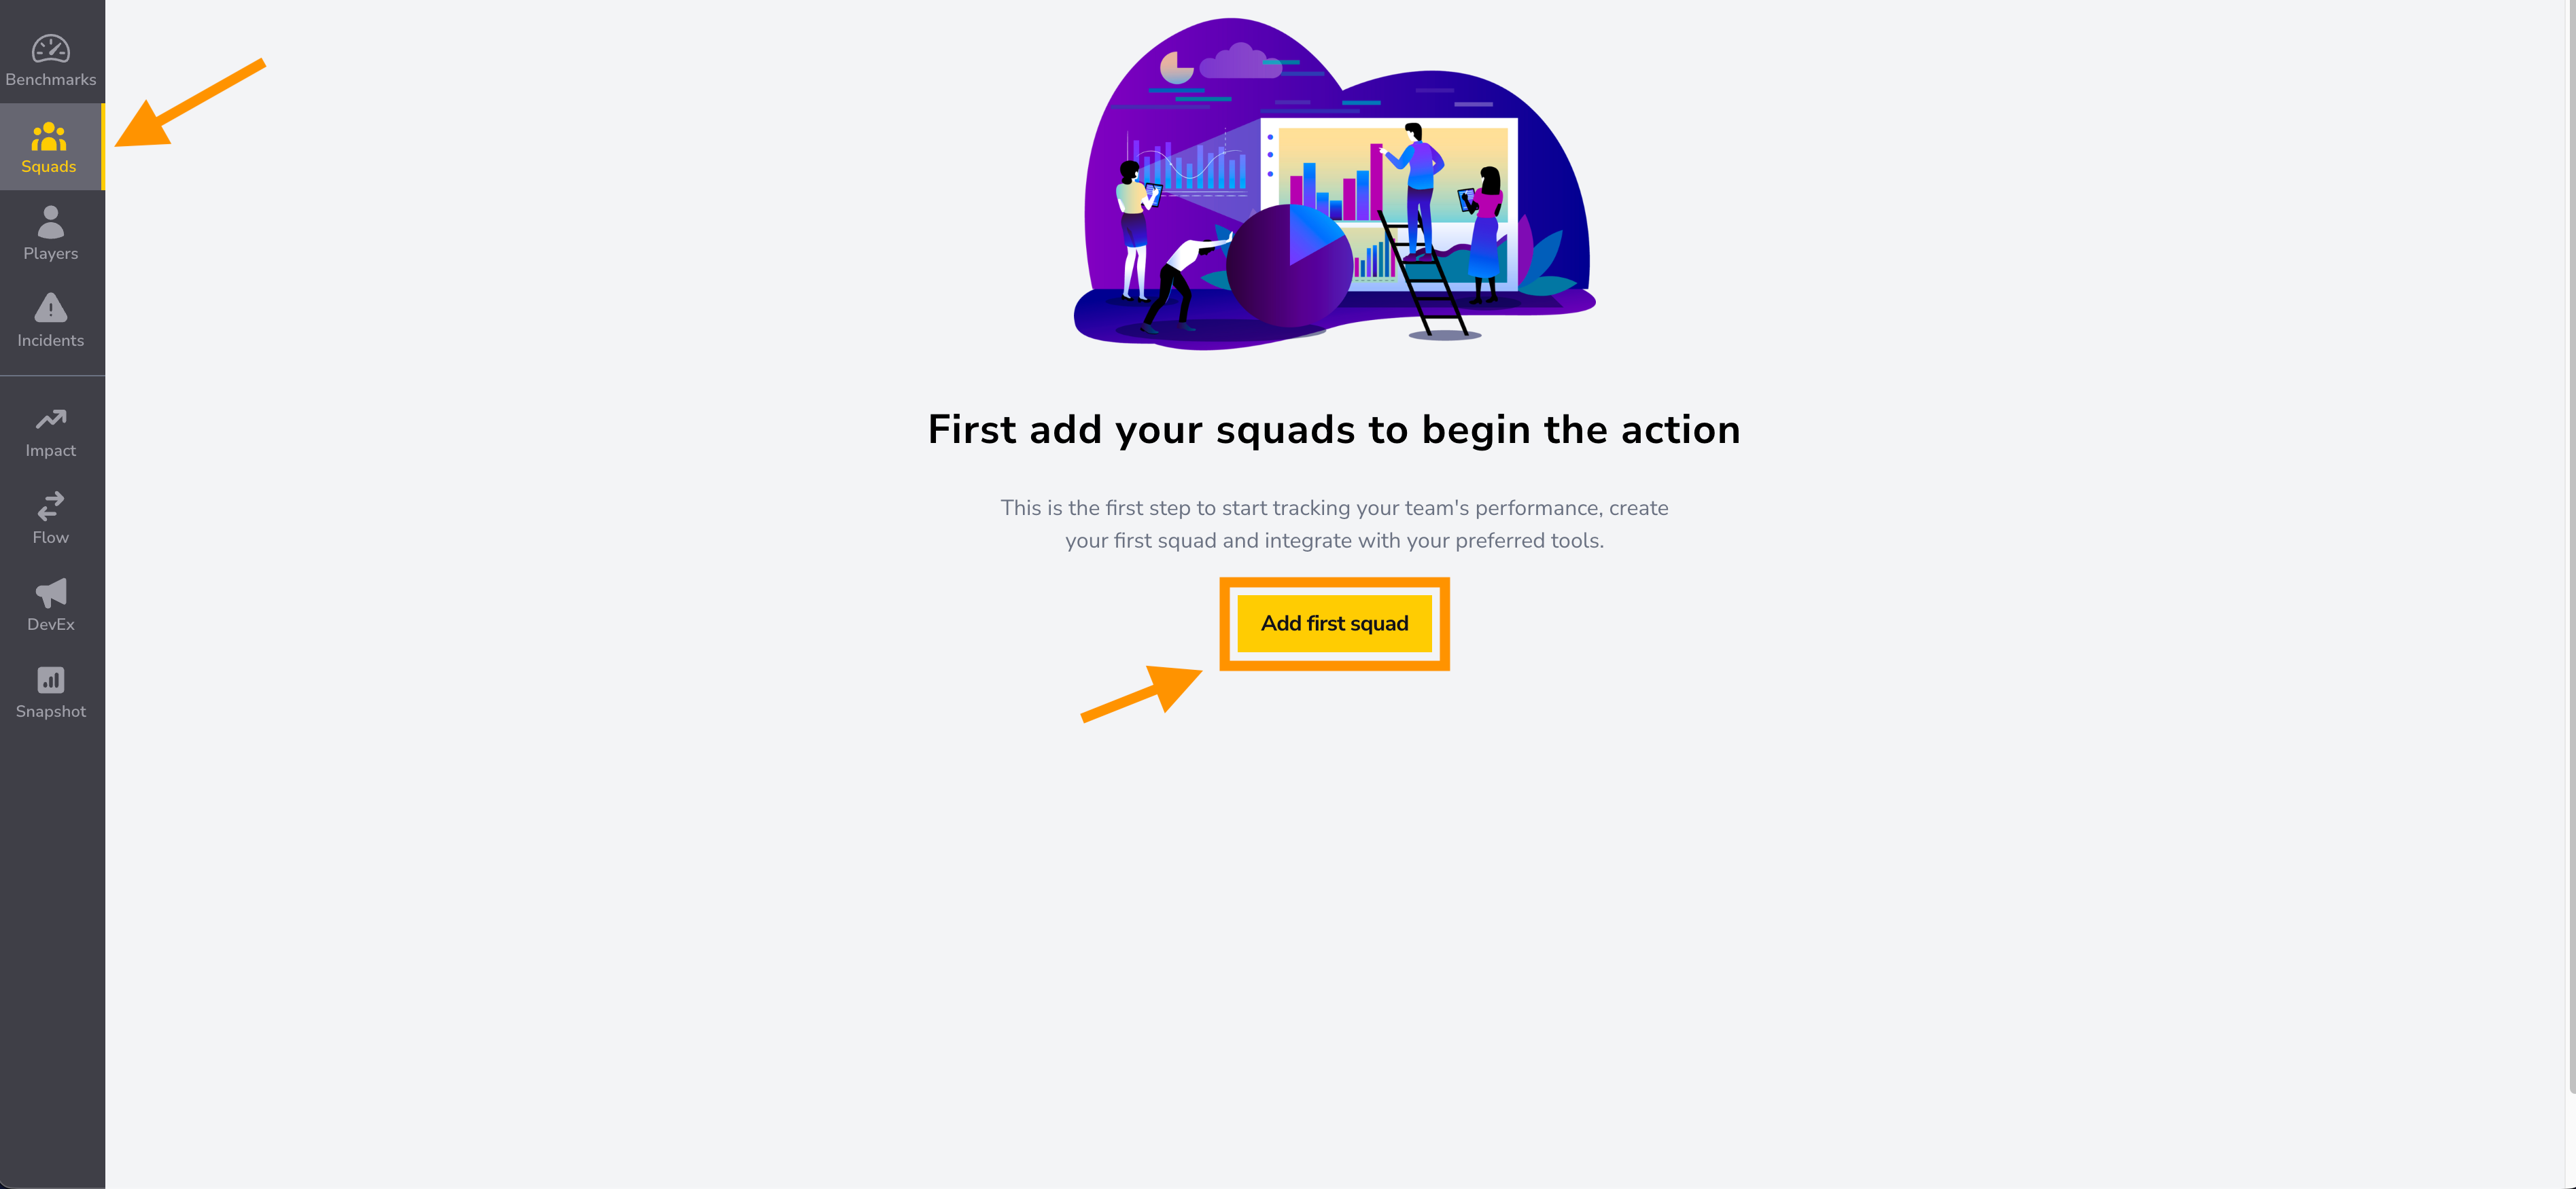
- Go to the Squads page in your dashboard.
- Click Add first squad.
- Enter a Squad name. You can also import repositories and projects now, or add them later from the squad's Integrations page.
- Click Create squad.
Step 3: Connect Your Data Sources
Once your squad is created, it's time to bring in data. DevStats supports three types of integrations — connect as many as apply to your team for the most complete picture.
🔗 Git Provider
Connect your source code platform so DevStats can track pull requests, commits, cycle time, and deployment activity.
| Provider | Docs |
|---|---|
| GitHub | View guide |
| GitLab | View guide |
| GitLab Self-Managed | View guide |
| Bitbucket | View guide |
| Bitbucket Data Center | View guide |
| Azure Repos | View guide |
For detailed, provider-specific instructions, refer to the individual guide linked above.
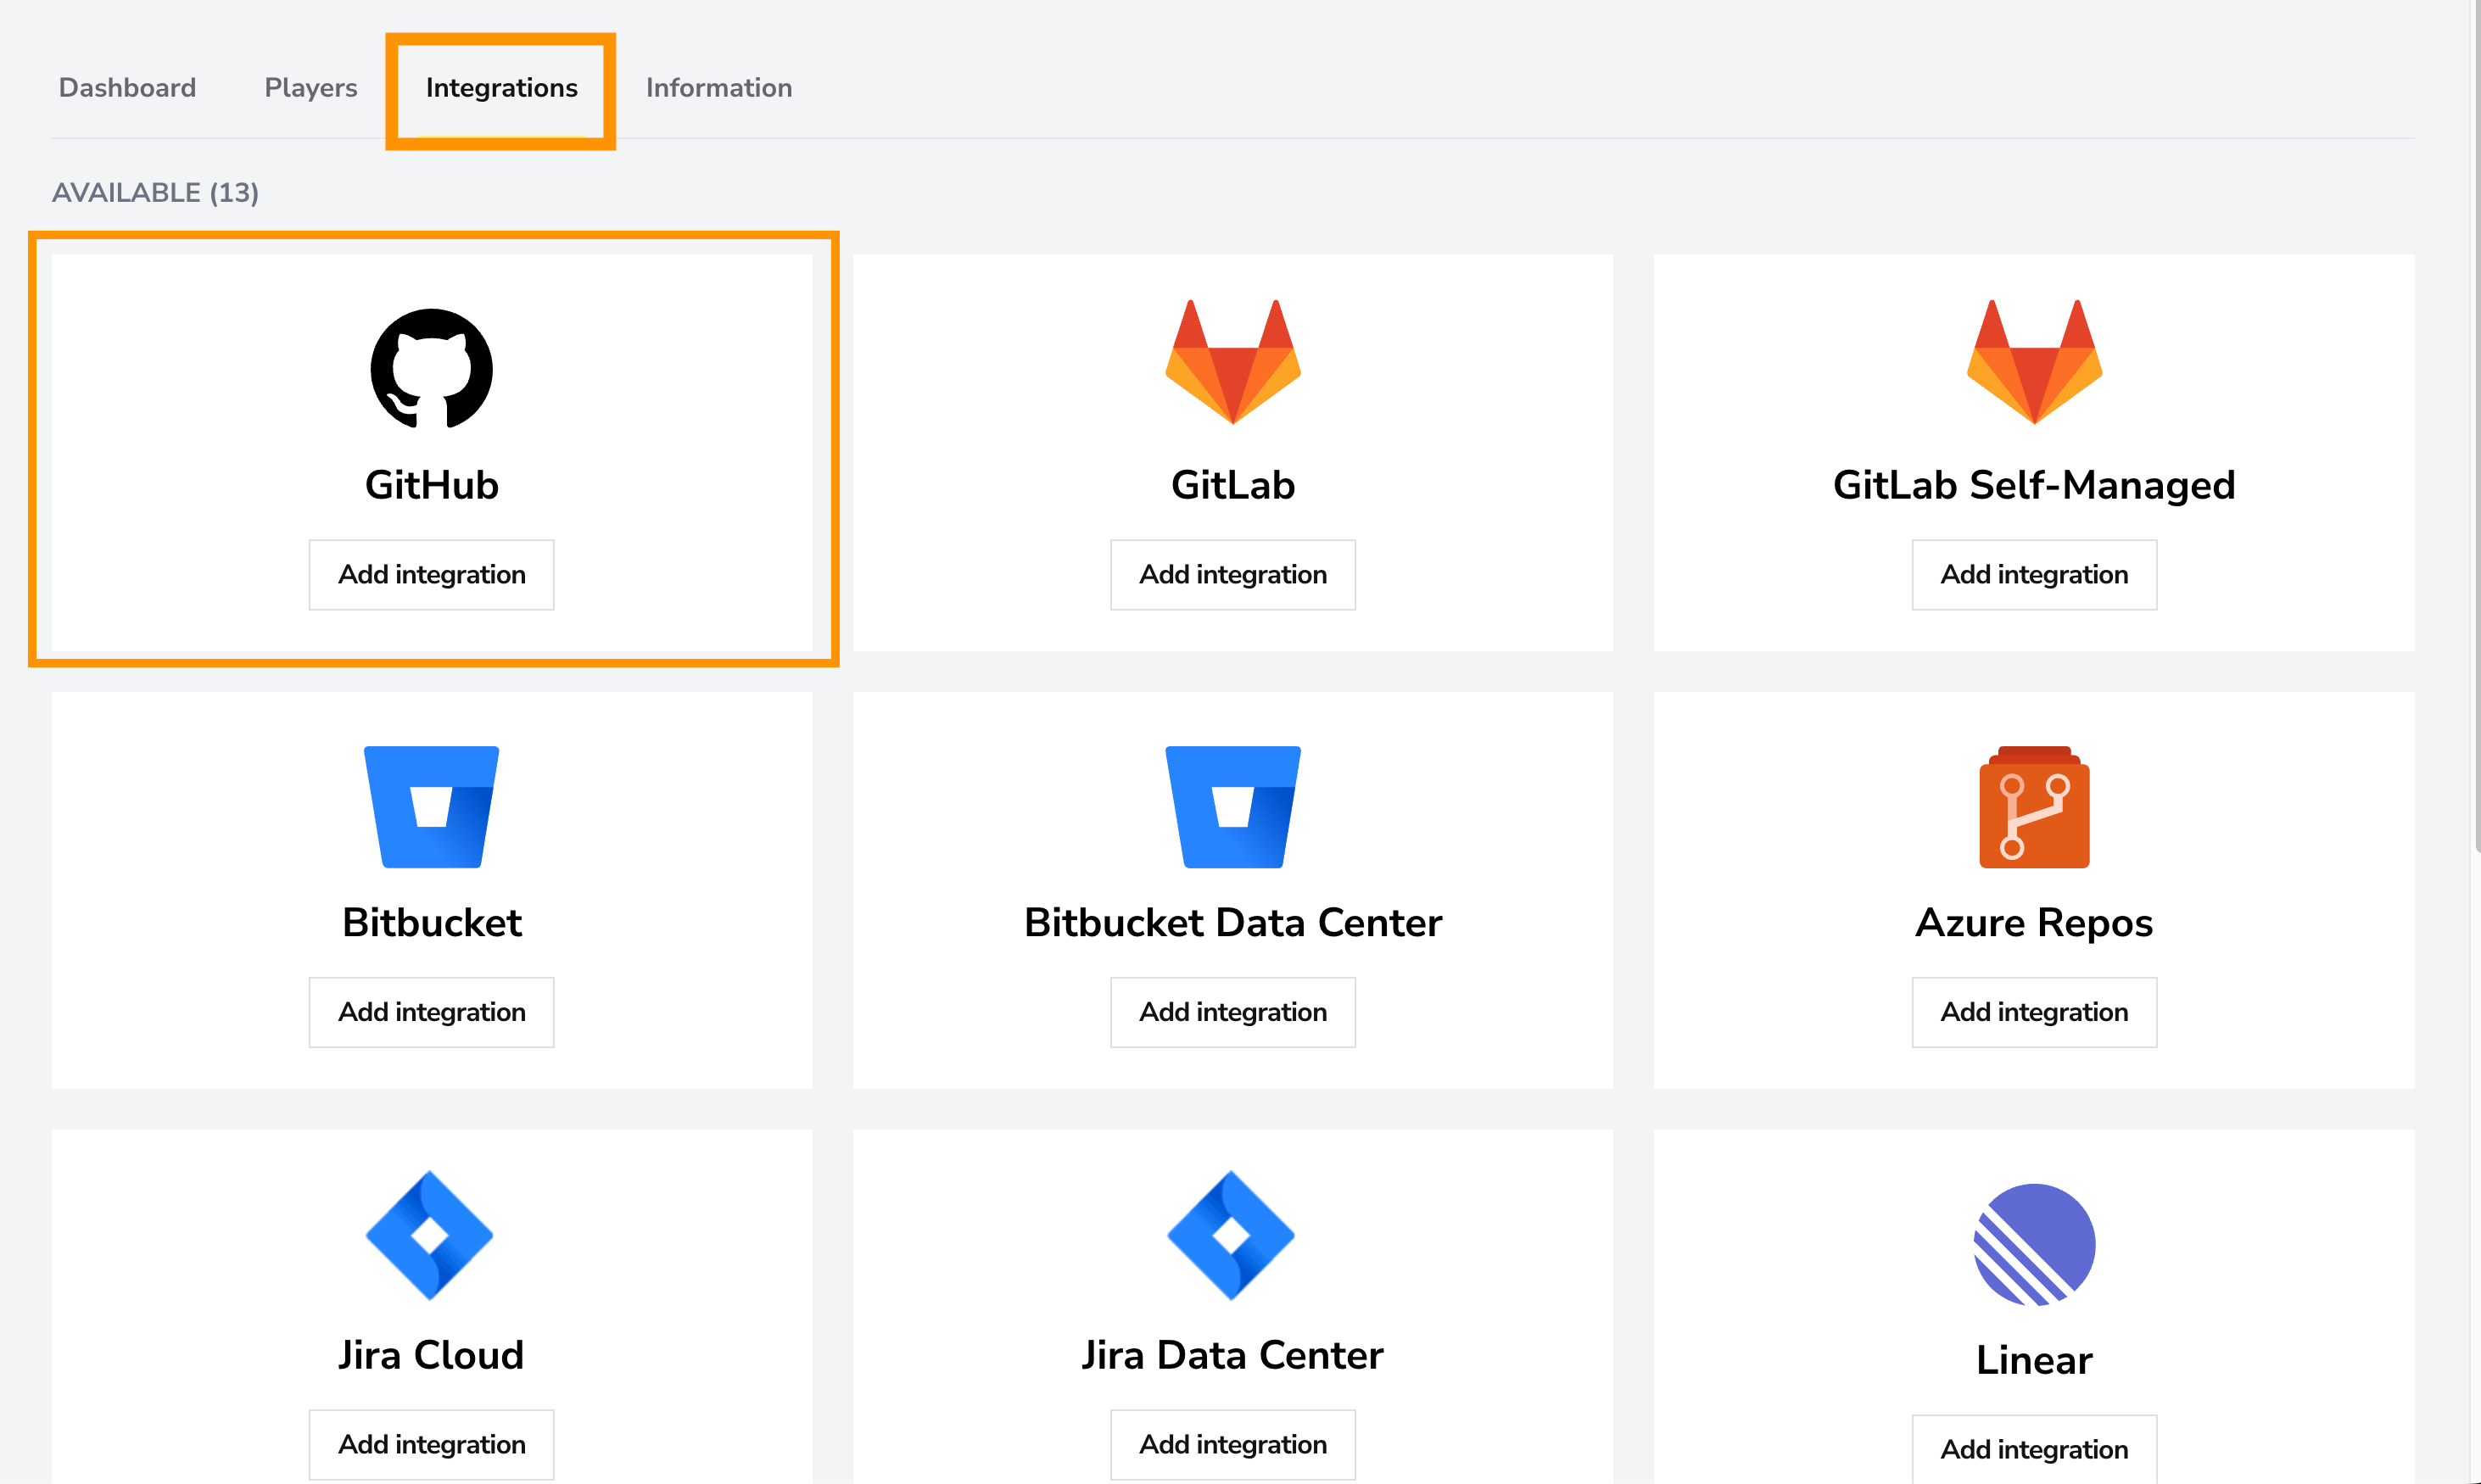
- Open your squad's Integrations page.
- Choose a Git provider and click Add integration.
- Follow the provider's authorization flow, select the repositories you want to track, and click Save integration.
After connecting, DevStats will begin importing your historical data. This may take a few minutes to a few days, depending on repository size. You will receive an email once your dashboards are ready.
📋 Issue Tracker
Connecting an issue tracker allows DevStats to read ticket labels, issue states, and cycle time data, significantly improving the accuracy of your metrics.
| Tracker | Docs |
|---|---|
| Jira Cloud | View guide |
| Jira Data Center | View guide |
| Linear | View guide |
| Azure Boards | View guide |
| GitHub Projects | View guide |
| ClickUp | View guide |
From the squad's Integrations page, choose your issue tracker, click Add integration, and follow the provider-specific guide linked above.
🤖 AI Tools (Optional)
Connect your AI coding tools to track usage and measure their impact on your team's productivity.
| Tool | Docs |
|---|---|
| GitHub Copilot | View guide |
| Claude | View guide |
Step 4: Explore Your Dashboards
Once data starts flowing in, your dashboards will populate automatically. Here are the key areas to start with:
- PR Cycle Time: Understand how quickly your pull requests move from creation to deployment.
- Deploy Frequency: Measure how often your team deploys code.
- Issue Cycle Time: Track how efficiently your team resolves tasks.