Overview
One of the main responsibilities of anyone leading an engineering squad, whether a Scrum Master, Tech Lead or Engineering Manager, is to make sure the team is not blocked. When blockers are removed early, the squad becomes faster, more predictable and less reactive. The goal is simple: unblock the team so work can keep flowing.
The three metrics that reflect delivery speed
Once blockers are removed, teams naturally become faster. You can measure this improvement through three key metrics in DevStats:
- PR Cycle Time: How long it takes for pull requests to move from creation to merge.
- Deployment Frequency: How often new code is deployed to production.
- Issue Cycle Time: How long it takes for an issue to go from start to completion.
These metrics help you understand what has already happened and highlight patterns in delivery flow, throughput and delays over time.
But before performance improves, you need to identify what is slowing teams down right now.
How to identify blockers in real time
To proactively remove friction, focus on three reports that reveal the current situation.
1. Aging Issues
The Aging Issues report shows how long issues have remained open, both in total time and by stage.
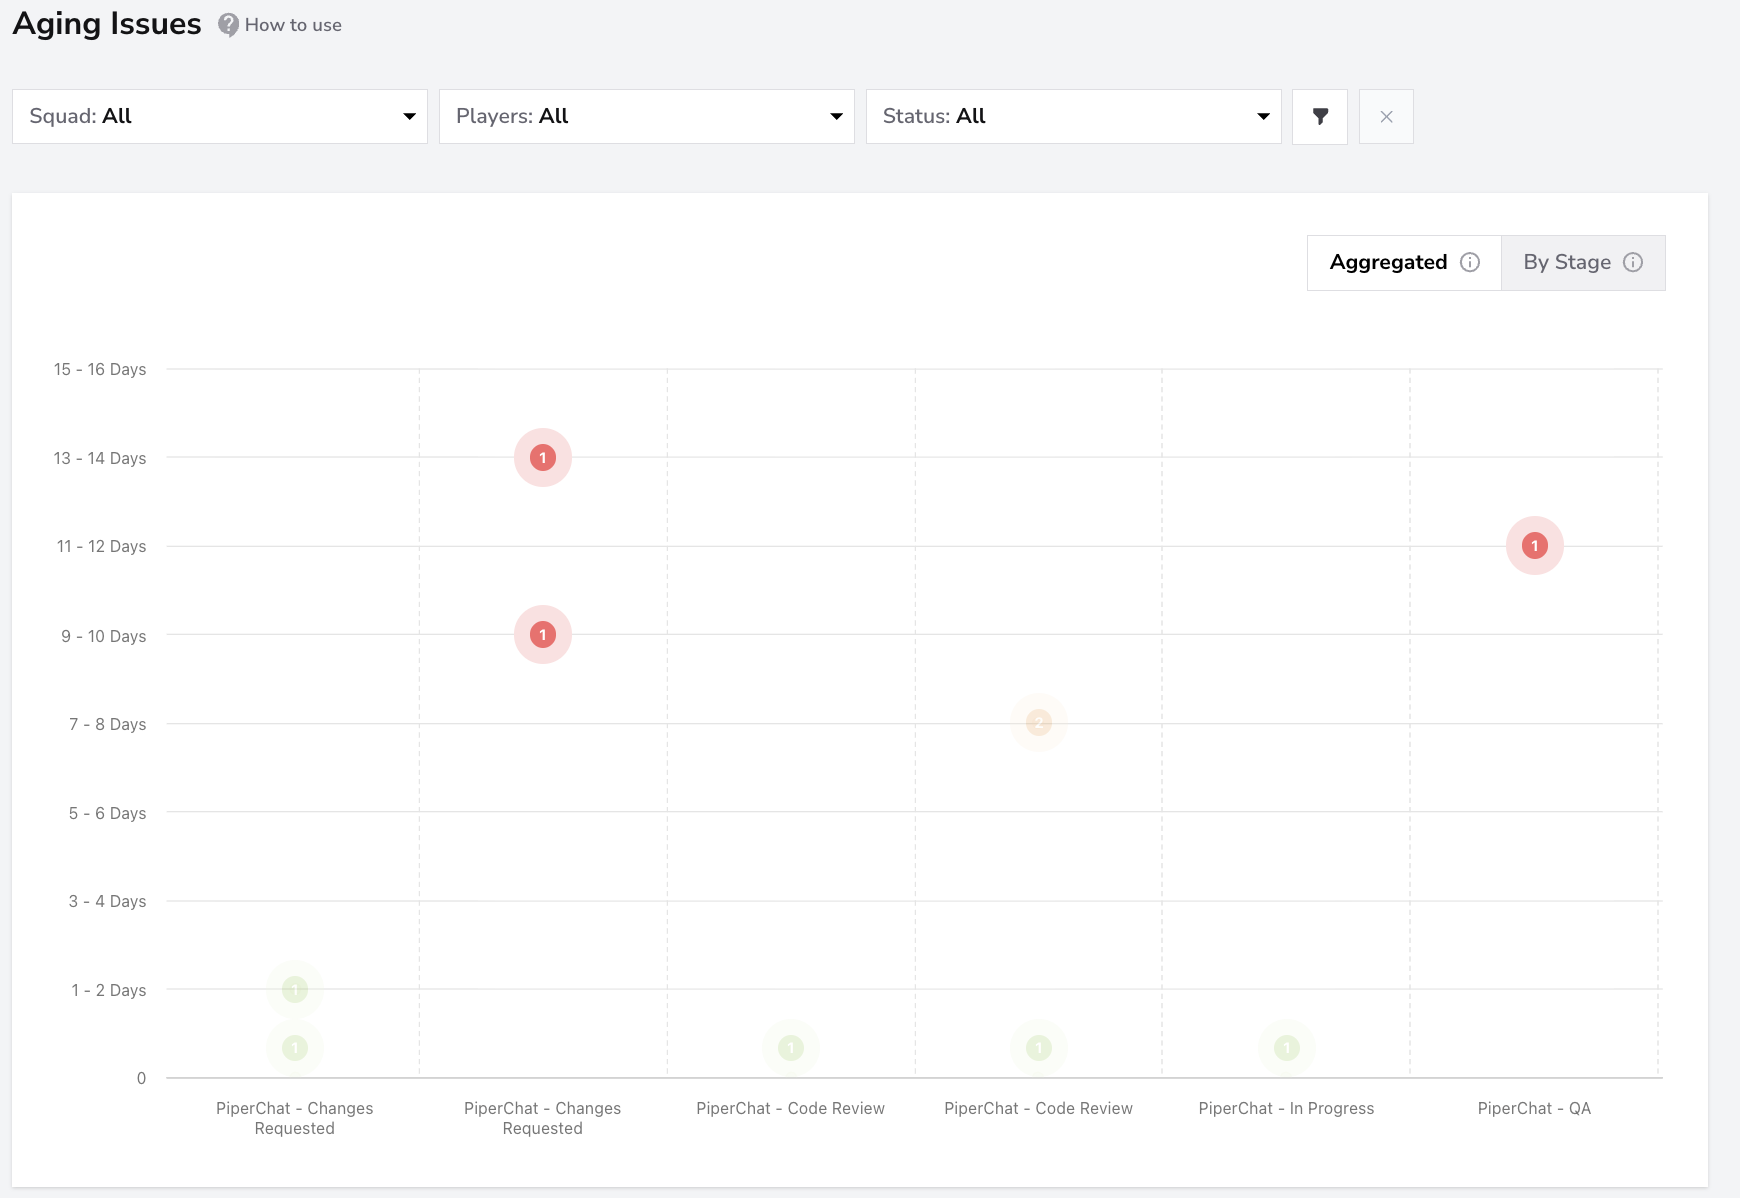
You can use this report to:
- Spot tasks that have been In Progress for too long.
- Discuss blockers during daily stand-ups and make them more actionable.
- Identify issues that are waiting and see exactly in which stage they are stuck.
Aggregated vs. By Stage
There are two complementary views in the Aging Issues report:
• By Stage:Shows how long each issue has stayed in its current workflow stage (e.g., In Progress, In Review, QA). Use this to diagnose where the team is currently stuck. If multiple issues show long aging times in the same stage, it signals a local bottleneck.
• Aggregated: Shows the total time each issue has spent across the workflow. This helps you understand overall flow efficiency and recurring patterns.
How This Identifies Blockers
- Red in By Stage indicates a local bottleneck
Red in Aggregated indicates systemic delays
Comparing both views helps you distinguish between temporary congestion and broader inefficiency. With this, you can rebalance workload, streamline reviews or reassign tasks early.
2. Aging Branches
The Aging Branches report highlights how long branches have been active without being merged.
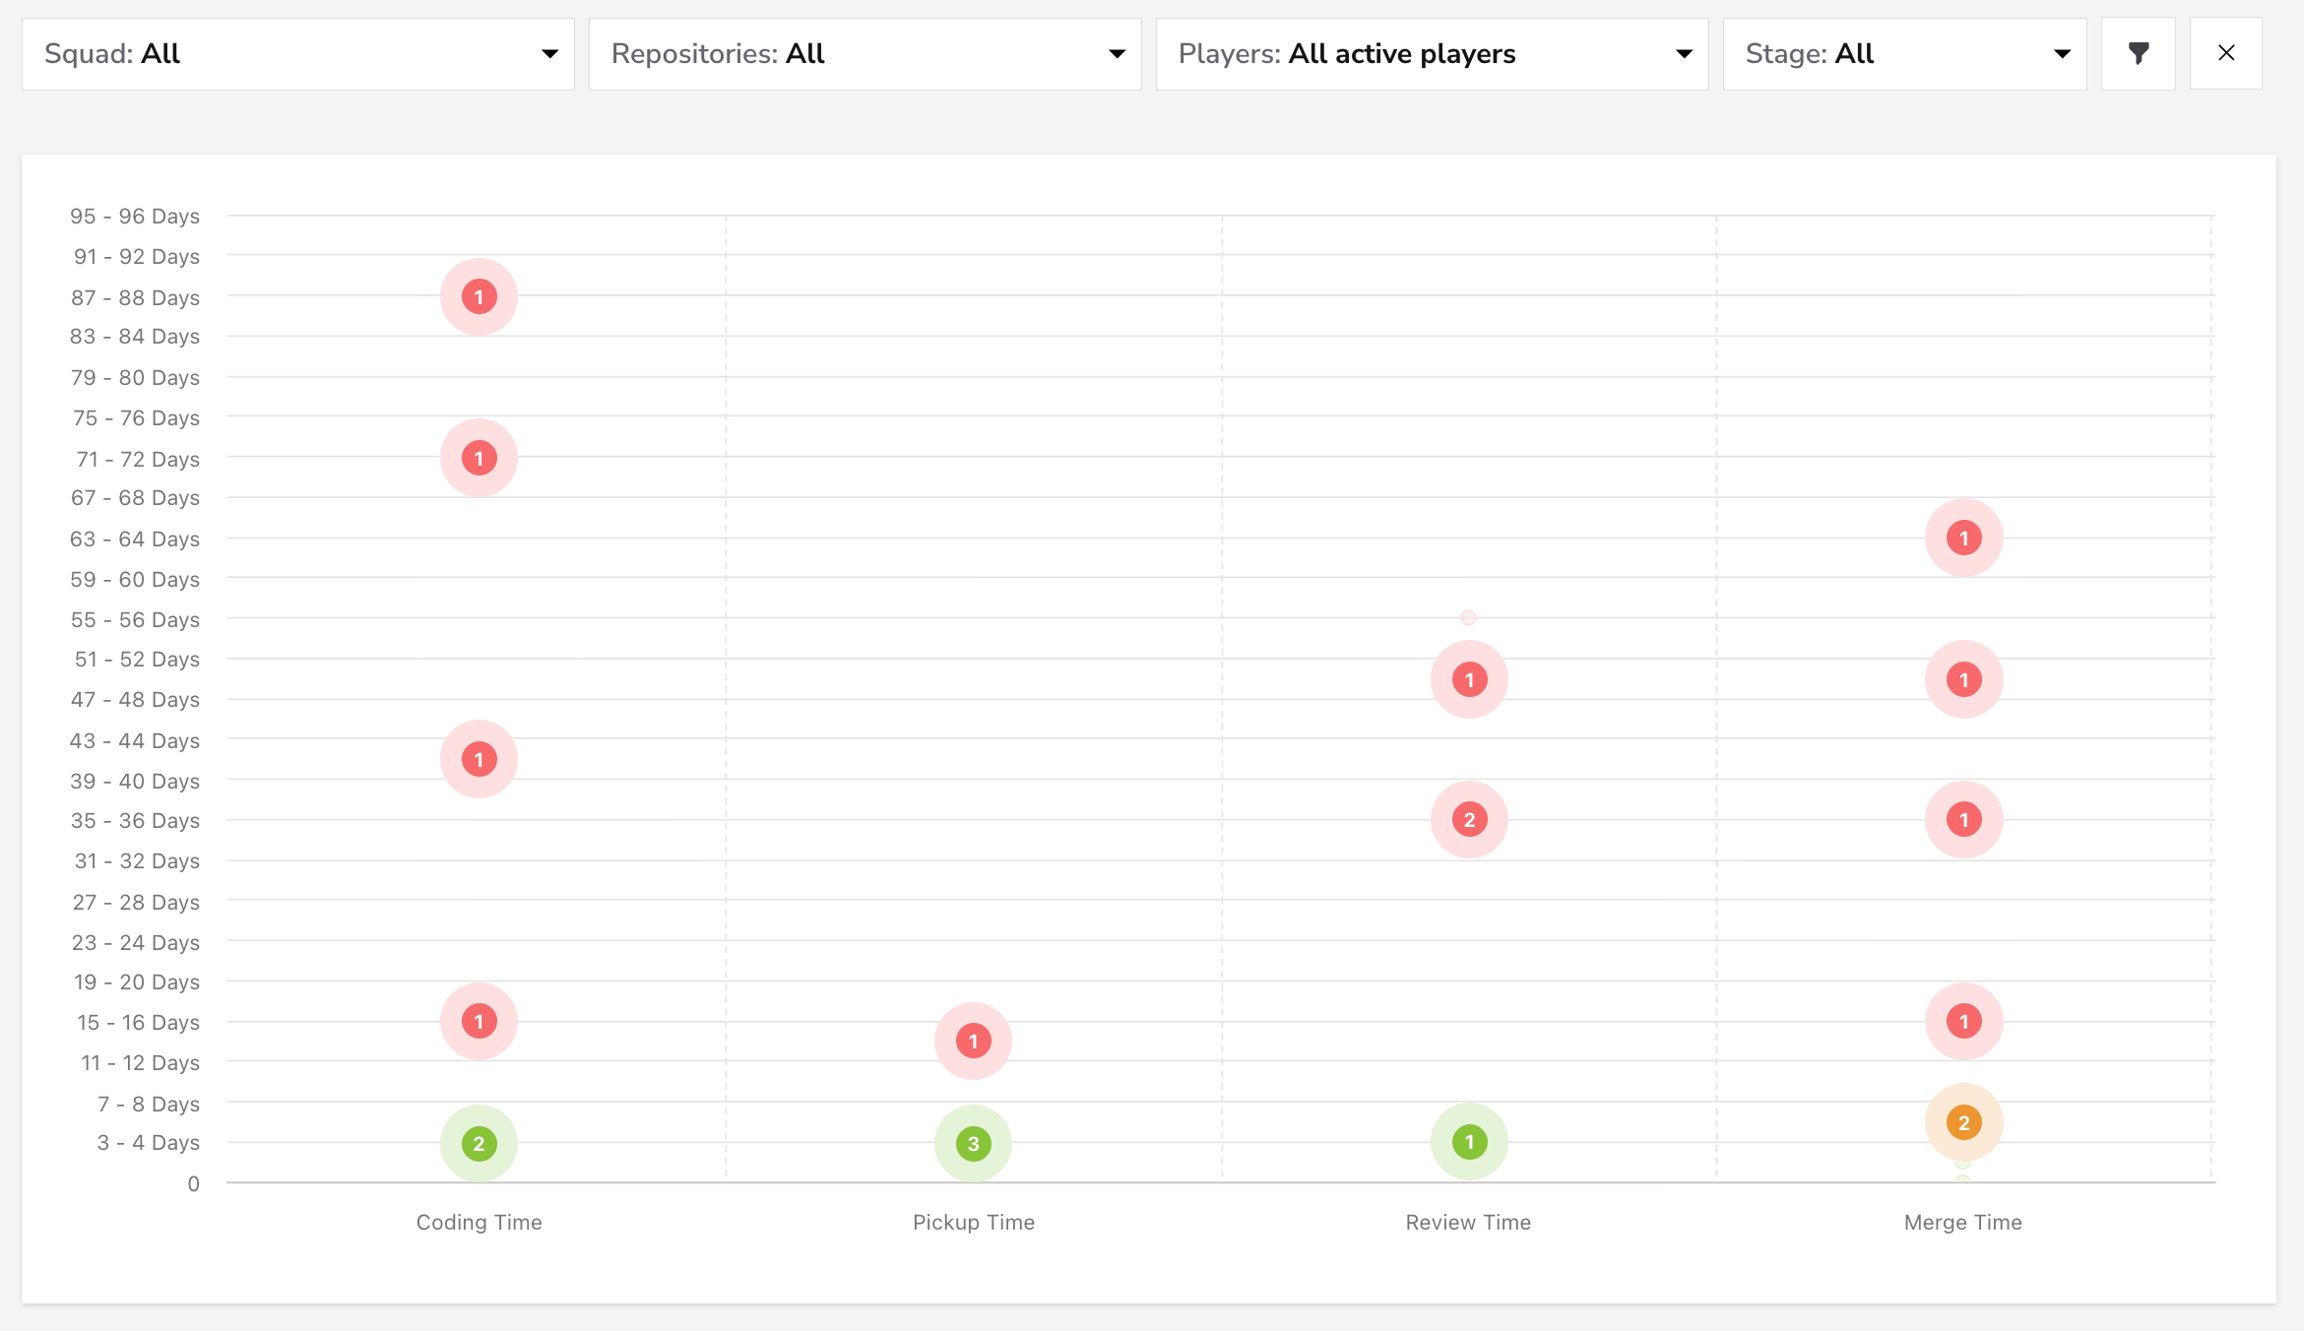
Use it to:
- Detect long-lived branches that may drift away from the main codebase.
- Surface delays and in which stage of the pr cycle time they are.
- Encourage smaller, more frequent merges to keep flow healthy.
Regular use helps eliminate hidden blockers in the development workflow.
3. Open Pull Requests
The Open PRs report provides visibility into all ongoing pull requests and their current review state. It helps teams ensure reviews are happening promptly and that work keeps flowing toward deployment.
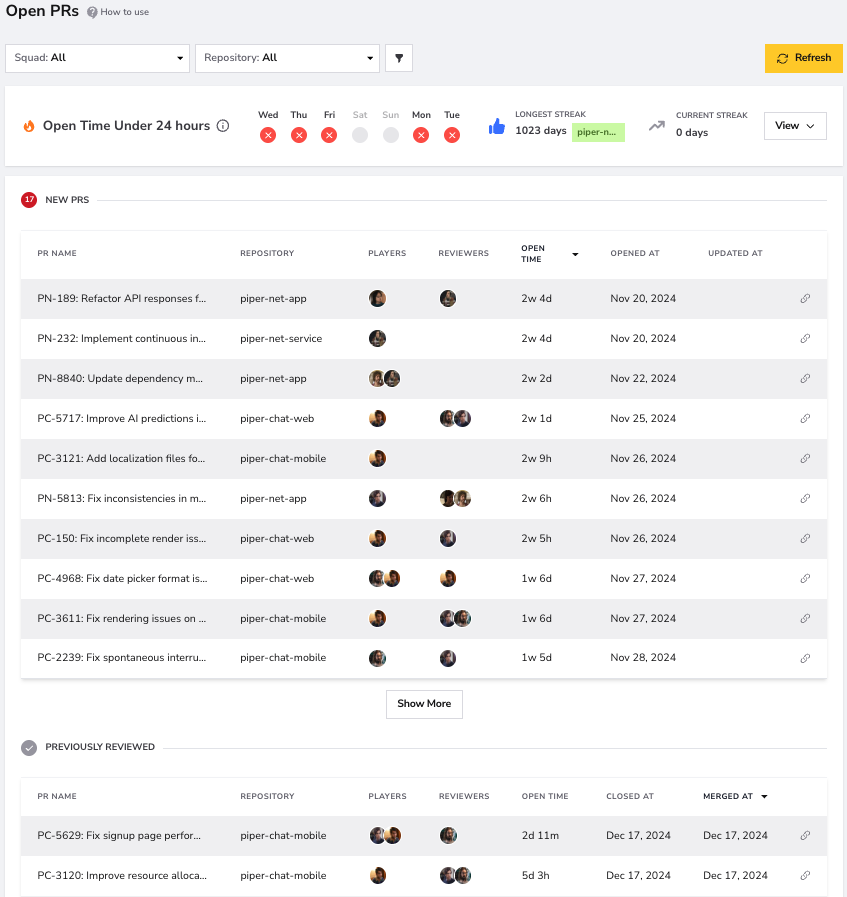
Use it to:
- Spot PRs waiting too long for review or approval (an early signal of potential bottlenecks).
- Keep the review flow healthy, ensuring that reviews and merges happen continuously rather than in bursts at the end of the sprint.
Each PR includes details like repository, authors, reviewers, and open time, allowing teams to act quickly where attention is needed most.
Why it matters
Pull requests that stay open for too long are one of the most common blockers in delivery flow. The Open PRs report gives you a real-time view of review throughput so you can:
- Rebalance workloads among reviewers.
- Surface PRs that are ready but waiting.
- Encourage smaller, more frequent merges that accelerate delivery and reduce rework.
When used alongside Aging Issues and Aging Branches, it keeps the team unblocked and moving!
Connecting the dots
While Aging Issues,Aging Branches and Open PRs show the current situation, the PR Cycle Time,Deployment Frequency and Issue Cycle Time metrics show historical trends.
- Use the aging and open PR reports in daily meetings to stay proactive.
- Use the cycle and frequency metrics in retrospectives to identify recurring patterns.
By combining these views, you can spot blockers early, remove them quickly and help your squad maintain a steady, predictable delivery rhythm.
Summary
Staying close to these reports provides the visibility needed to act early before slowdowns turn into delivery problems.
| Goal | Use these reports... | Measure impact with... |
|---|---|---|
| Identify and remove blockers | Aging Issues, Aging Branches, Open PRs | PR Cycle Time, Deployment Frequency, Issue Cycle Time |