What is the PR Cycle Time Feature?
The PR Cycle Time Dashboard provides a comprehensive view of how long it takes for pull requests (PRs) to progress from creation to deployment. It breaks down the PR lifecycle into five key stages: Coding, Pickup, Review, Merge and Deploy. This allows teams to analyze each phase in detail, identify bottlenecks and optimize their delivery pipeline.
How It Works
PR Cycle Time measures the total time from when a pull request is created until it is deployed to production. The metric is split into five stages:
| Stage | Starts | Ends |
|---|---|---|
| Coding | First commit | PR is created |
| Pickup | PR is created | First review activity (such as an inline comment or discussion comment) |
| Review | First review activity (such as an inline comment or discussion comment) | Final review before merge |
| Merge | Last human review activity | PR is merged |
| Deploy | PR is merged | Merge commit appears in the deploy branch |

With Average or Percentile, the Controls panel lets you choose at least two stages to include in the total. Mode uses all five stages.
If your team does not use a dedicated deploy branch or has not connected a deploy data source, the Deploy stage will not be tracked.
Metrics
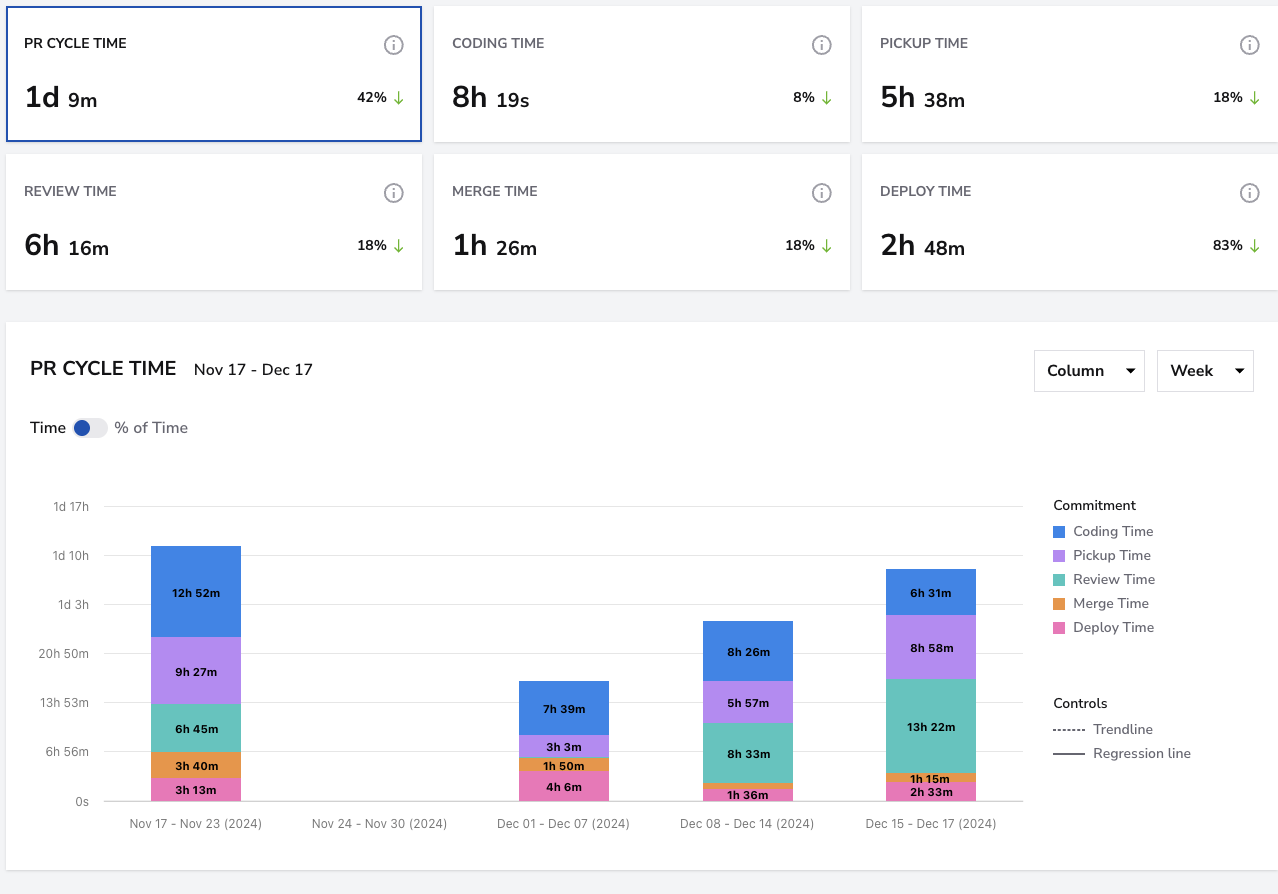
PR Cycle Time
- What: Total time from first commit to production deploy.
- How to use it: Shorter cycle times mean faster delivery. Track the average over time to set benchmarks and spot where the process is slowing down.
- User interface:
Coding Time
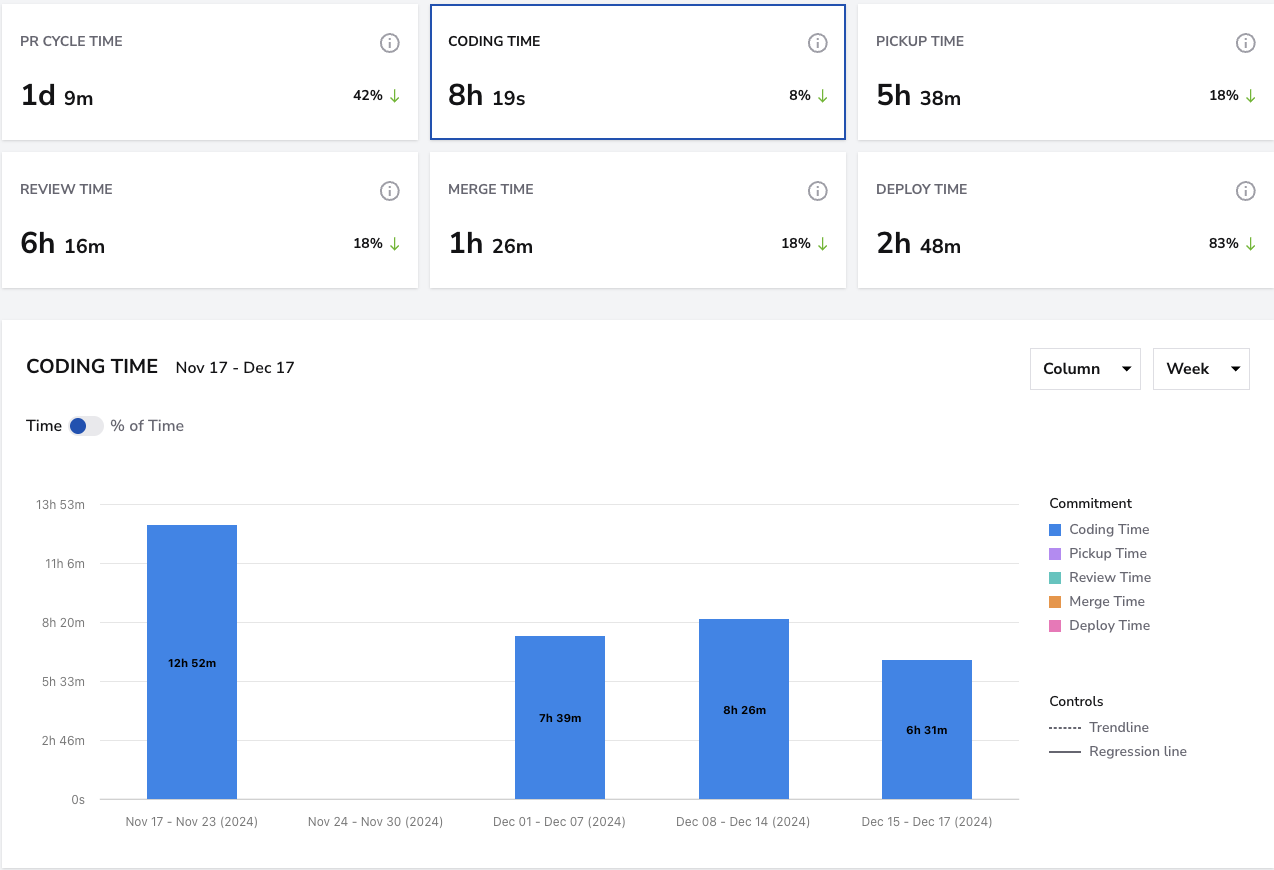
- What: Time from the first commit to PR creation.
- How to use it: Long coding times often mean tasks are too large. Breaking them into smaller pieces reduces complexity and makes reviews easier.
- User interface:
Pickup Time
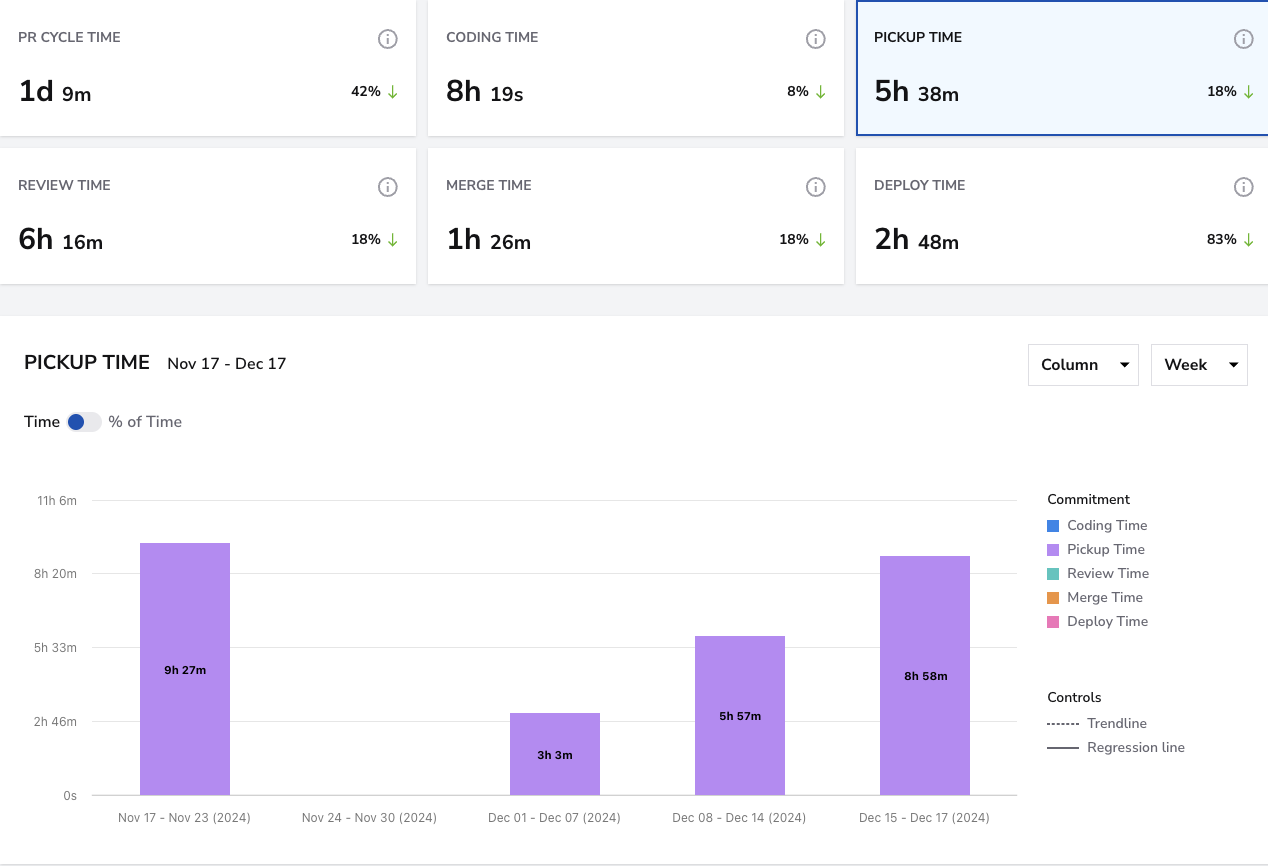
- What: Time from PR marked ready for review to the first reviewer starting.
- How to use it: High pickup times stall delivery. If consistently high, adjust review assignments or increase reviewer capacity.
- User interface:
Review Time
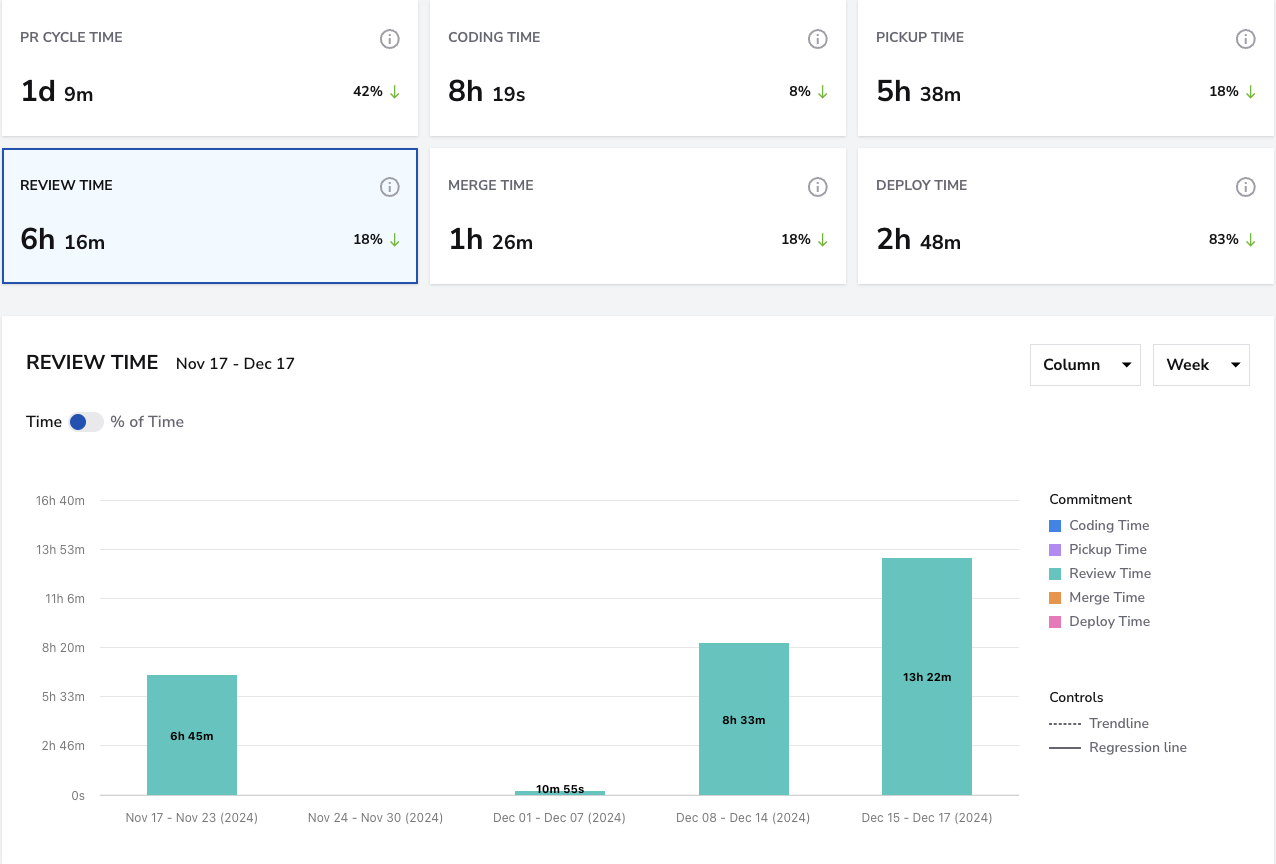
- What: Time from the first review comment to the final review before merge.
- How to use it: Extended reviews indicate unclear expectations or reviewer bottlenecks. Standardizing the process and setting clear guidelines helps keep this stage on track.
- User interface:
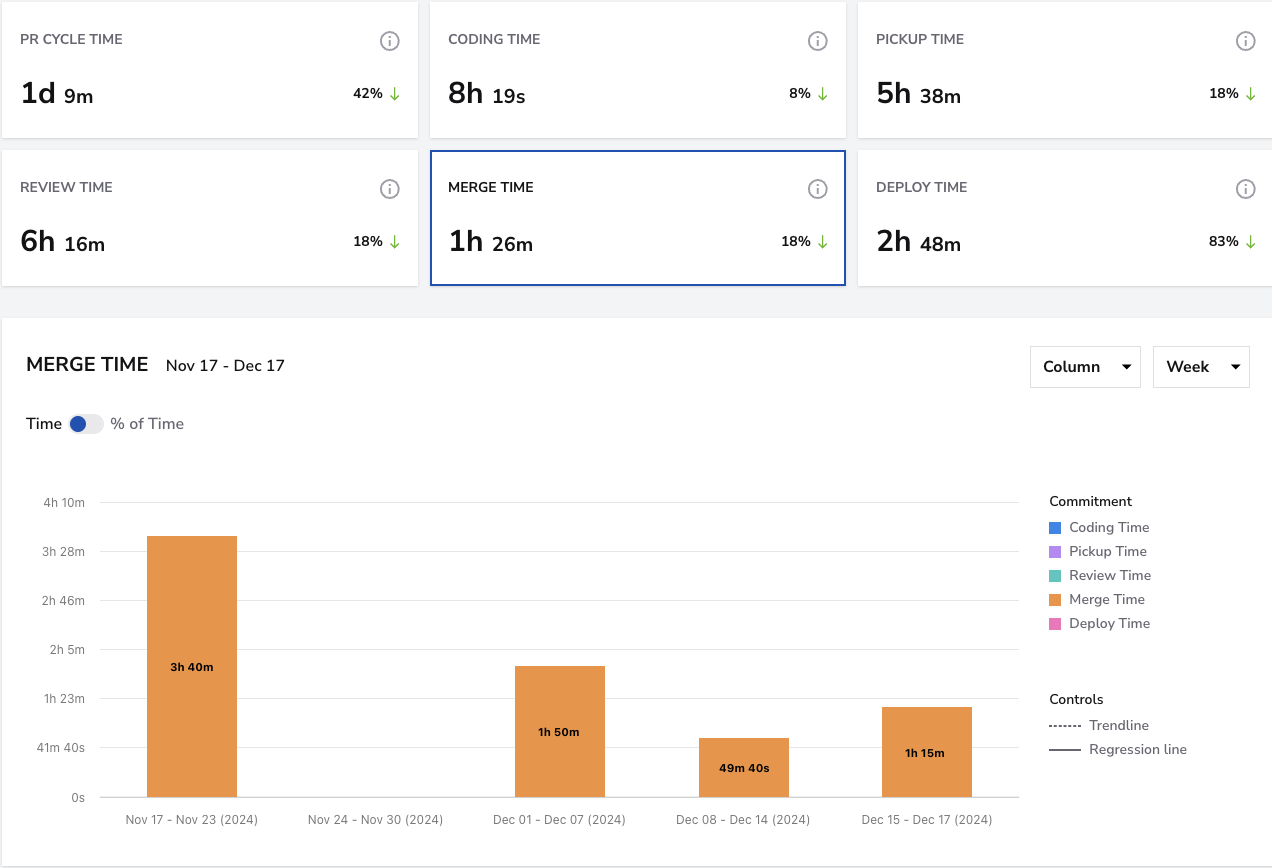
Merge Time
- What: Time from the last review activity to the PR being merged.
- How to use it: High values point to friction after approval, CI delays, merge queues, or manual steps. Parallelizing CI runs or reducing required checks can help.
- User interface:
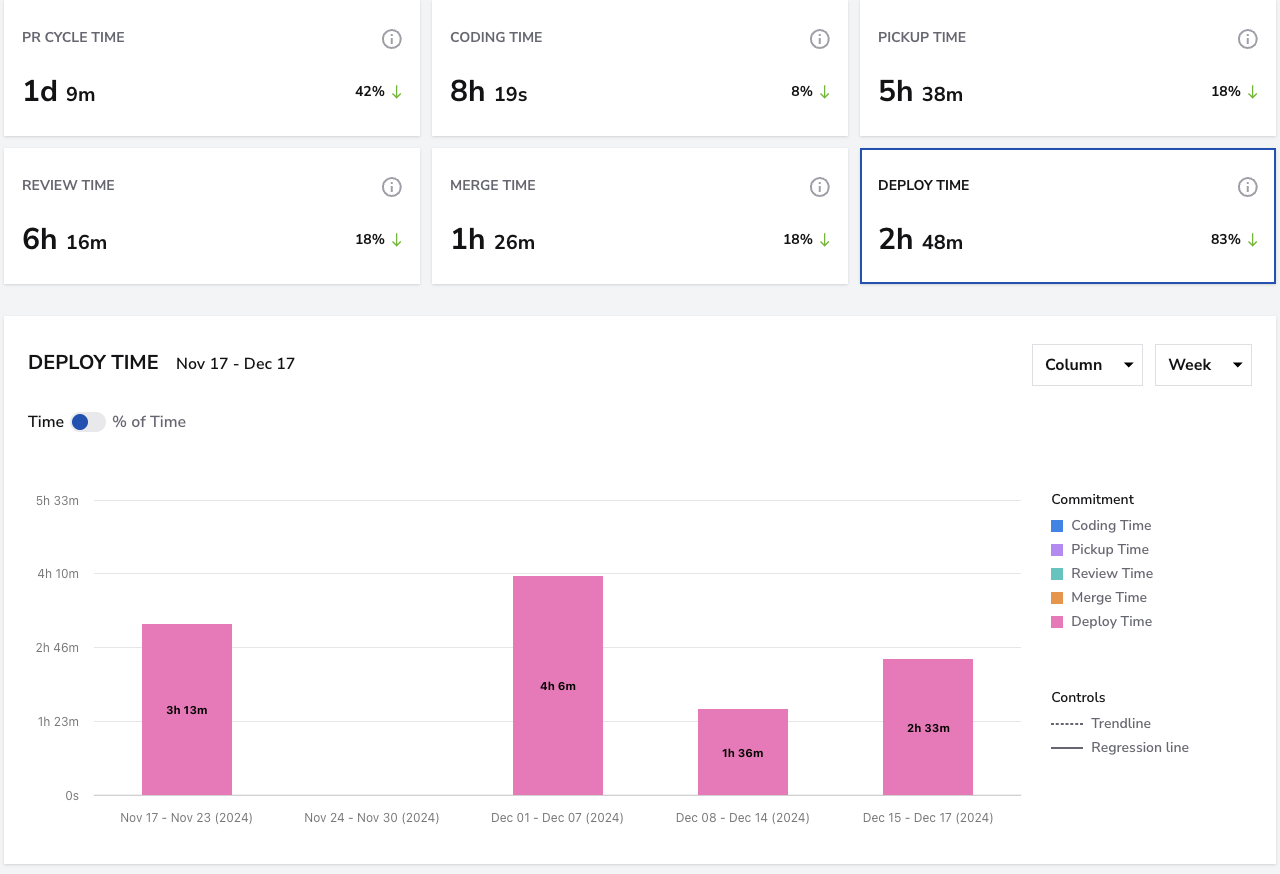
Deploy Time
- What: Time from PR merge to the merge commit appearing in the deploy branch.
- How to use it: Long deploy times delay value reaching users. Automating pipeline stages or increasing deploy frequency brings this down significantly.
- User interface:
PR Cycle Time Dashboard
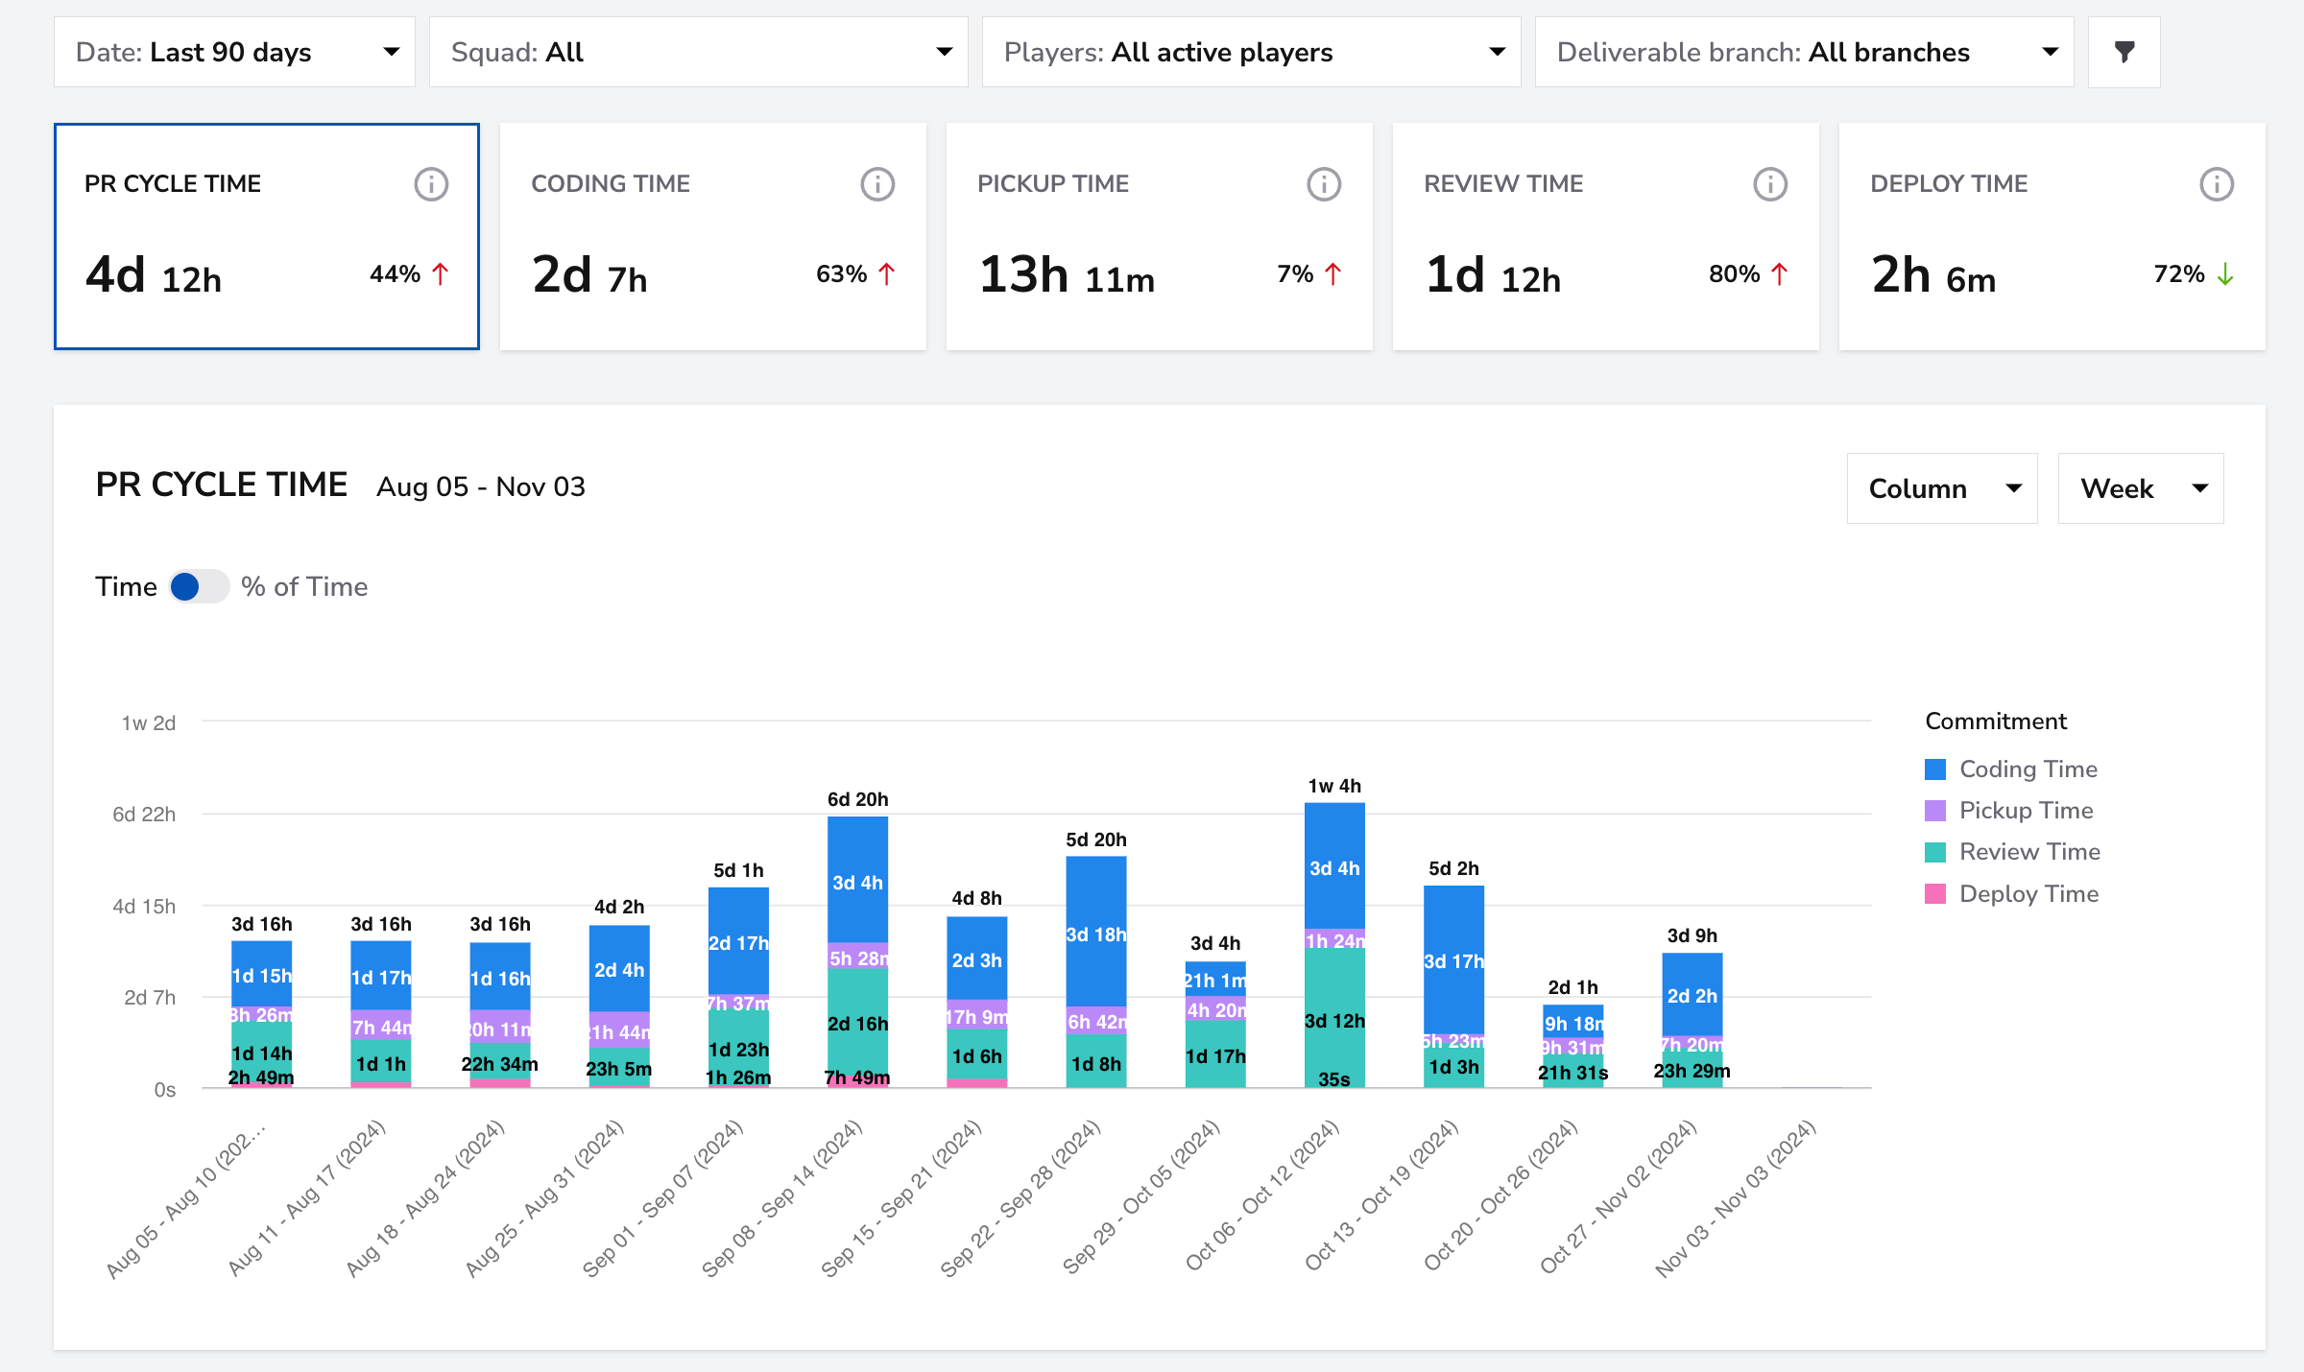
The PR Cycle Time feature includes a bar chart that visually represents the different metrics over a selected period. Each bar represents a breakdown of the different metrics for the selected period, which can be broken down into days, weeks, or months. Below the chart, you can find a list of all PRs. If you click on the arrow next to one of the PRs, you'll get a detailed overview of that PR.
Filters
Use the Squad Filter to view PR Cycle Time metrics for individual squads. If you want a broader overview of all teams, select the "All" filter to see the breakdown across all squads at once.

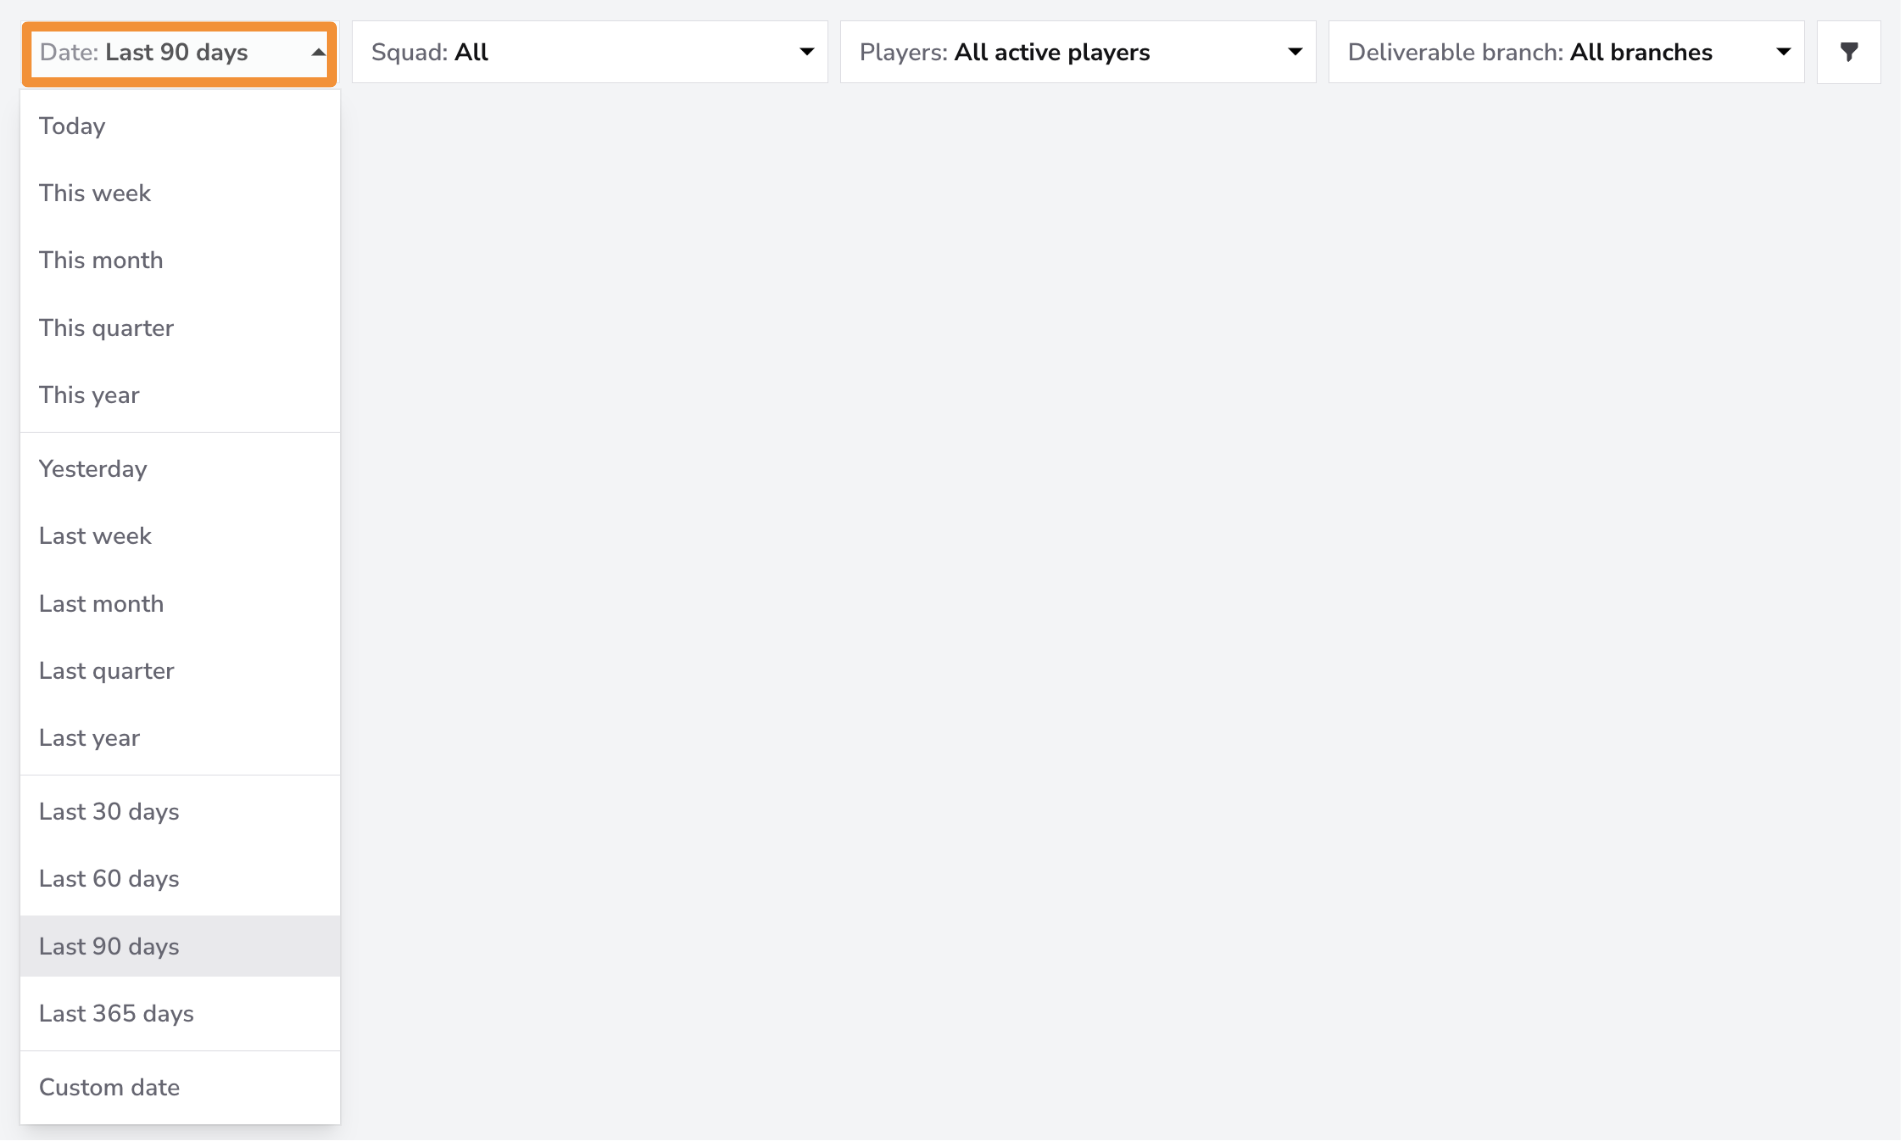
The Date Filter allows you to view data for specific time periods. You can filter for the last month, quarter, or 365 days. If you need more granular control, you can filter by a custom date range.
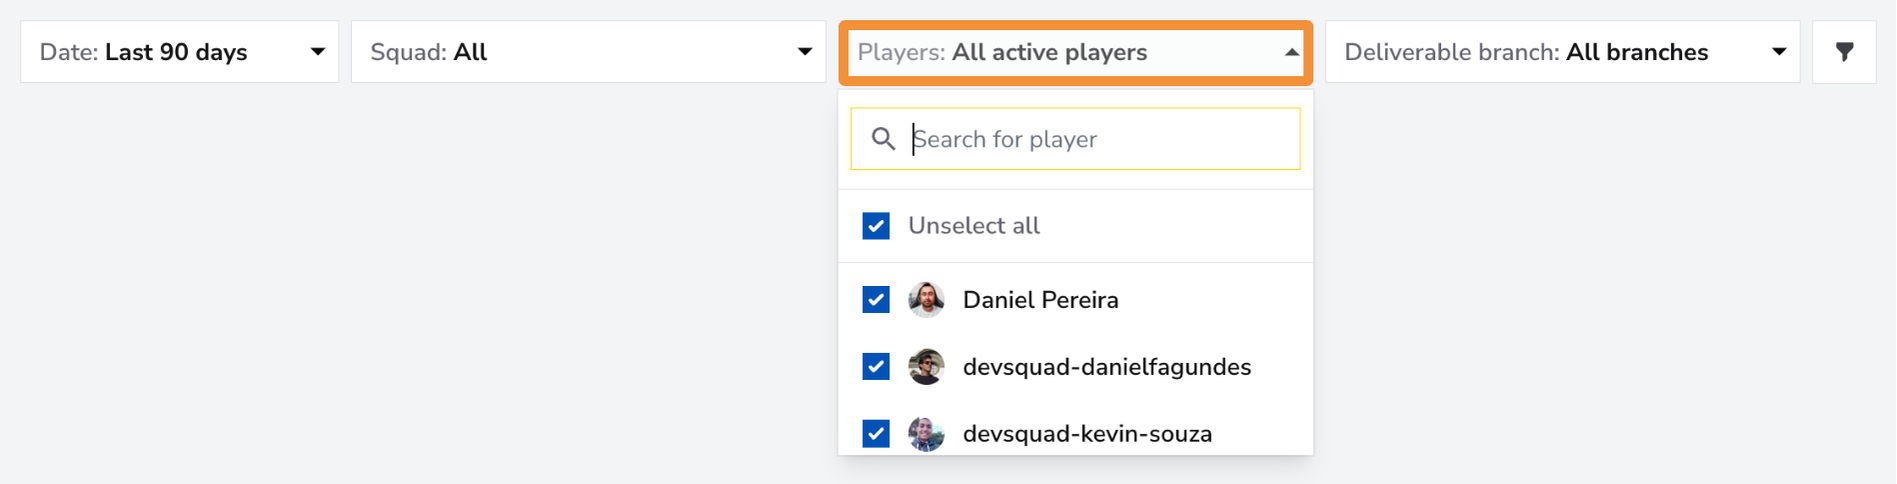
Use the Players Filter to focus on individual team members or a specific group within your squad. You can select one member for a detailed view, a group of team members if they form a sub-squad, or all team members for an overview of the entire squad's PR Cycle Time metrics.
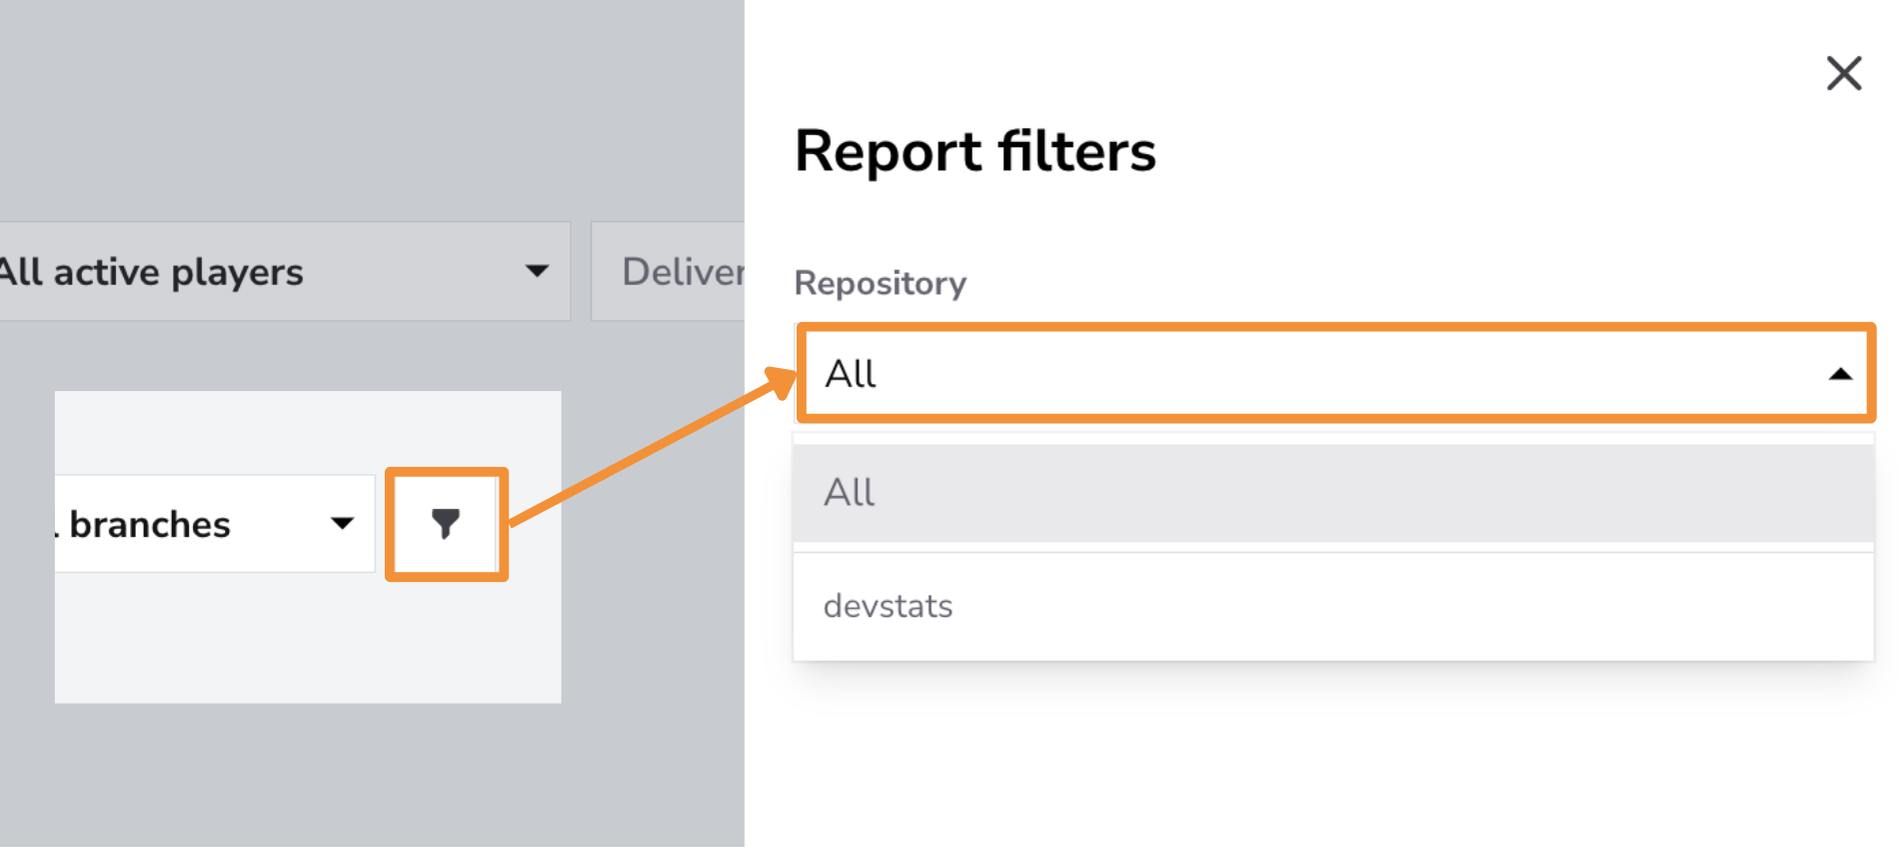
Use the Repository Filter to focus on specific repositories or view PR Cycle Time metrics across all repositories. This filter is particularly useful for isolating patterns and performance in individual codebases, especially when working across multiple repositories. Examining PR Cycle Time by repository allows you to identify bottlenecks, optimize review and deployment practices, and ensure consistency in workflows across different parts of your codebase.
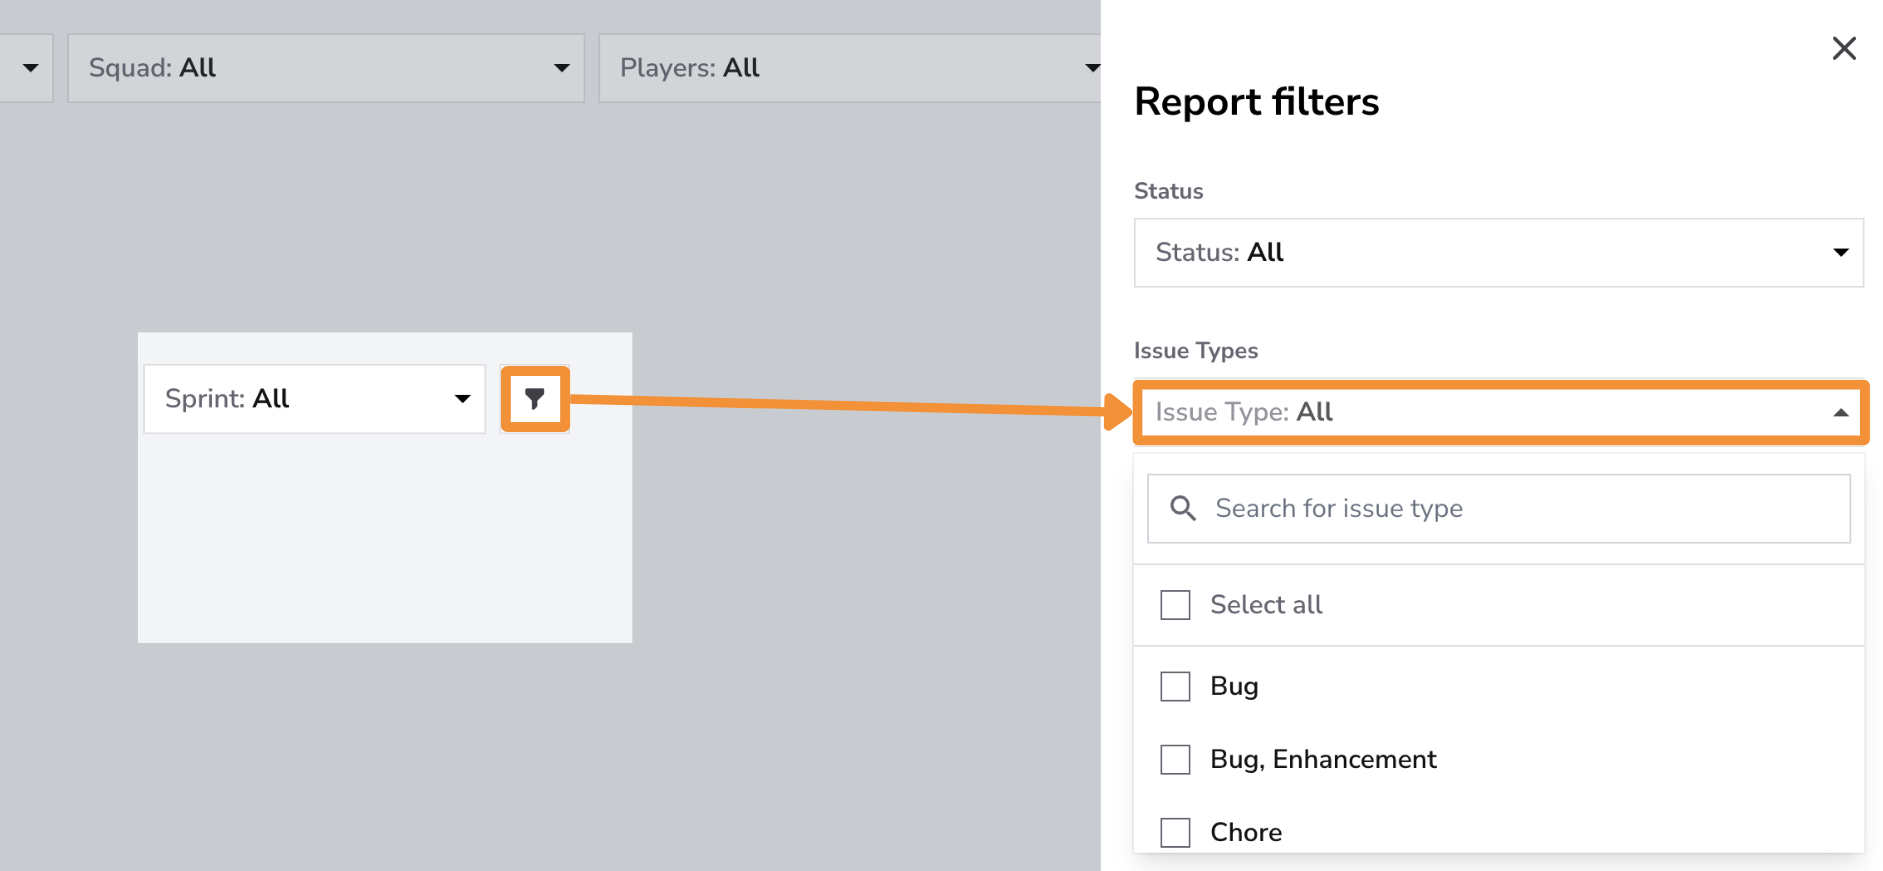
Use the Issue Type Filter to focus on specific issue types, such as Features, Bugs, Enhancements, or Hotfixes. This filter helps track how long it takes to move each issue type through the PR cycle, from creation to deployment. Monitoring these times is especially important for critical issues like hotfixes and bugs, ensuring they are addressed and deployed quickly to maintain product stability and minimize user impact.
Controls in the PR Cycle Time Dashboard
Use Controls to select Average, Mode, or Percentile, and enable Trendline or Regression line.
Under PR Cycle Time Stages, choose which of Coding, Pickup, Review, Merge, and Deploy contribute to the total. Keep at least two stages selected. Mode always uses all five stages and disables stage selection. Saving a changed stage selection returns to the overall PR Cycle Time card.
Click the adjustments button on the Controls bar and select Save after choosing your options. See the Controls guide for details.
Explore Best Practices
Conclusion
The PR Cycle Time Dashboard is a powerful tool for tracking and optimizing the efficiency of your pull request process. By focusing on each stage of the PR lifecycle, teams can identify bottlenecks, streamline workflows, and ultimately deliver value to users more quickly and reliably.