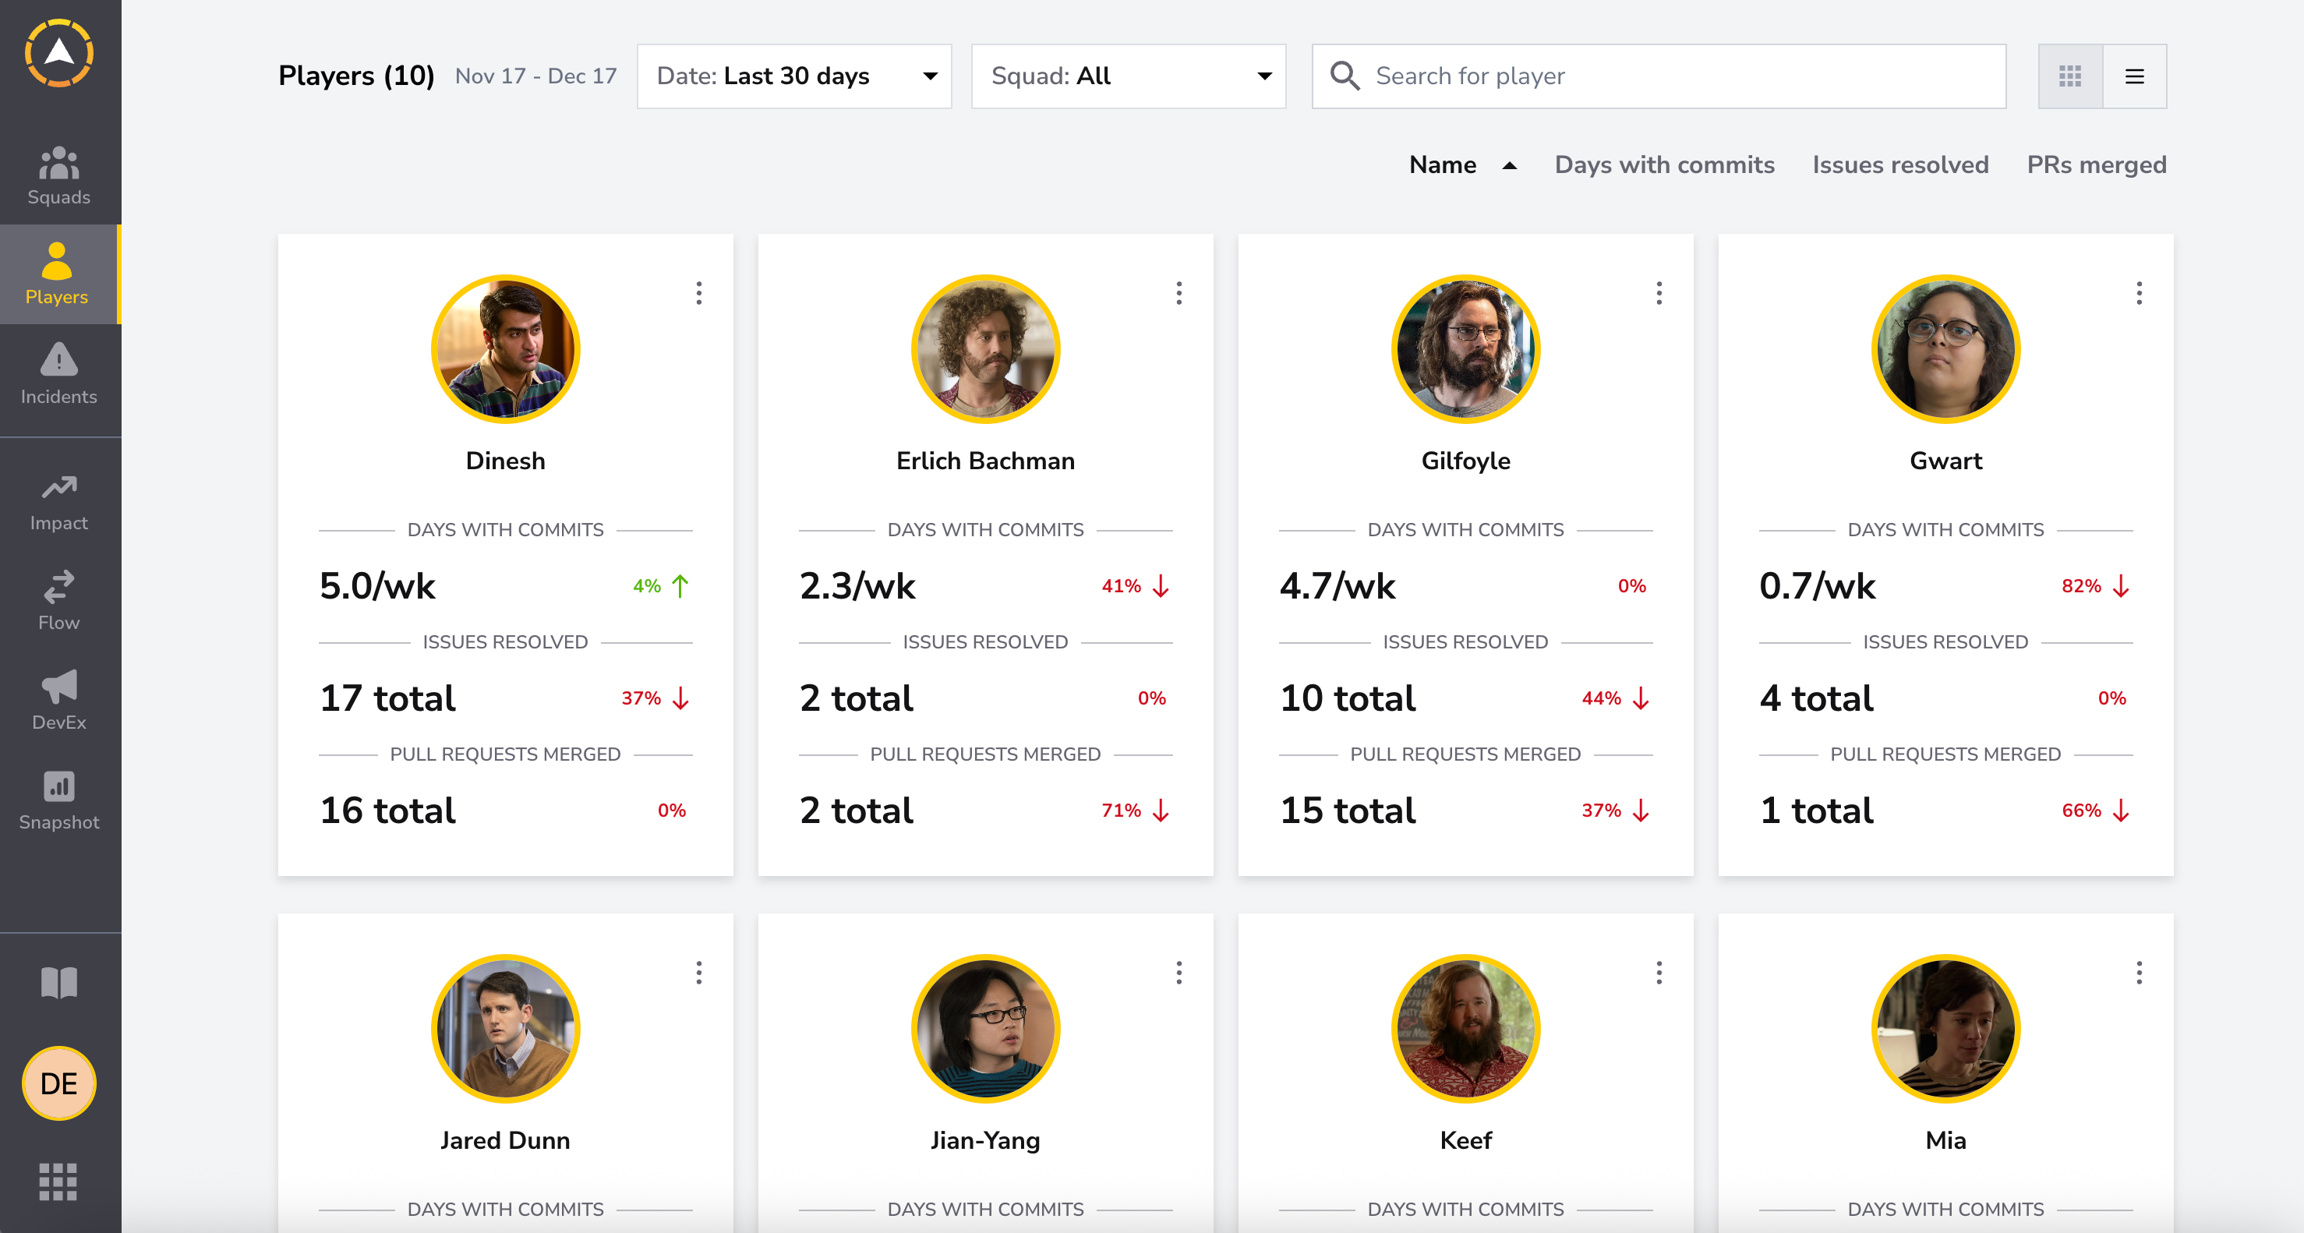
The Players Page provides a clear and structured overview of the individual performance of every contributor in your squad. It consolidates key activity indicators, such as days with commits, issues resolved, and pull requests merged, allowing teams to quickly understand workload distribution, contribution patterns, and areas that may benefit from support or coaching.
This page is essential for gaining visibility into how each developer collaborates within the team, helping leaders promote healthy engineering practices, encourage balanced workloads, and identify opportunities for improvement or recognition.
By using this feature, engineering leaders and teams gain a deeper understanding of individual contribution behaviors and can align team practices with organizational goals.
Why track individual player metrics?They help teams understand contribution patterns , support onboarding , recognize high-impact contributors, and prevent workload imbalance or burnout.
Key Features
Card View
The Card View presents a quick snapshot of key metrics for each player in a visually organized format. Each card displays:
Days with Commits: How frequently a player contributes code.
Issues Resolved: Total number of tasks resolved by the player.
PRs Merged: Number of pull requests successfully merged.
Trends: Metrics include percentage increases or decreases compared to the previous period.
Sorting:
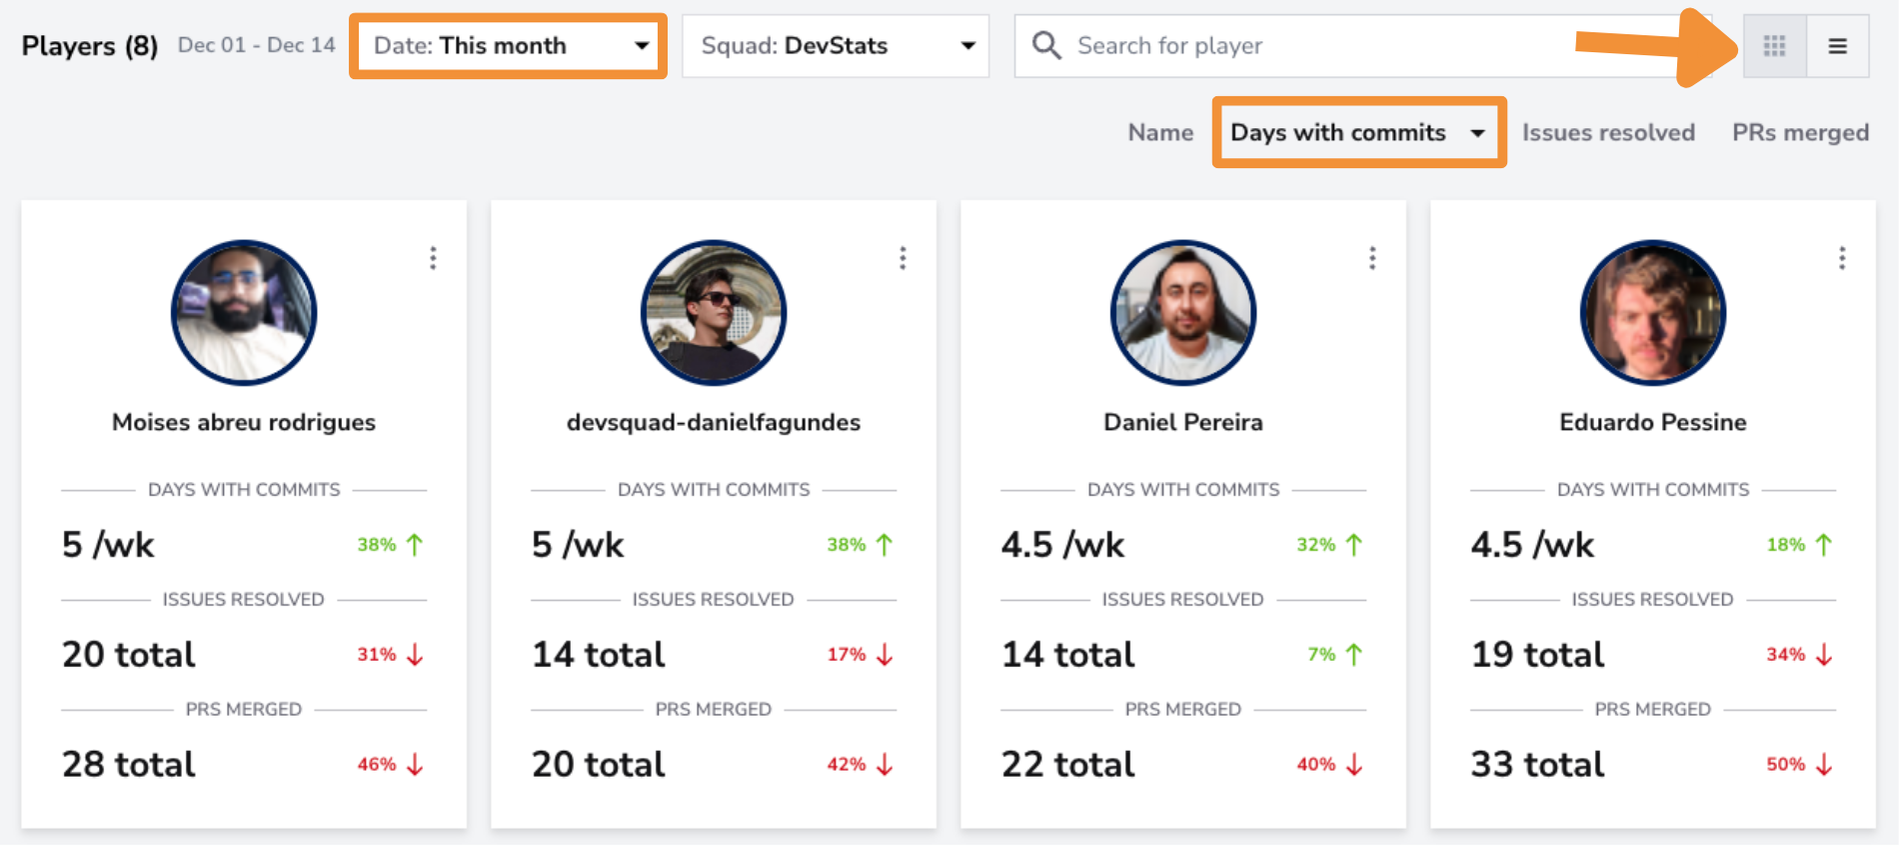
Click on "Name," "Days with Commits," "Issues Resolved," or "PRs Merged" to sort players in ascending or descending order. For example, the below UI screenshot shows sorting by Days with Commits (highest to lowest).
Filters:
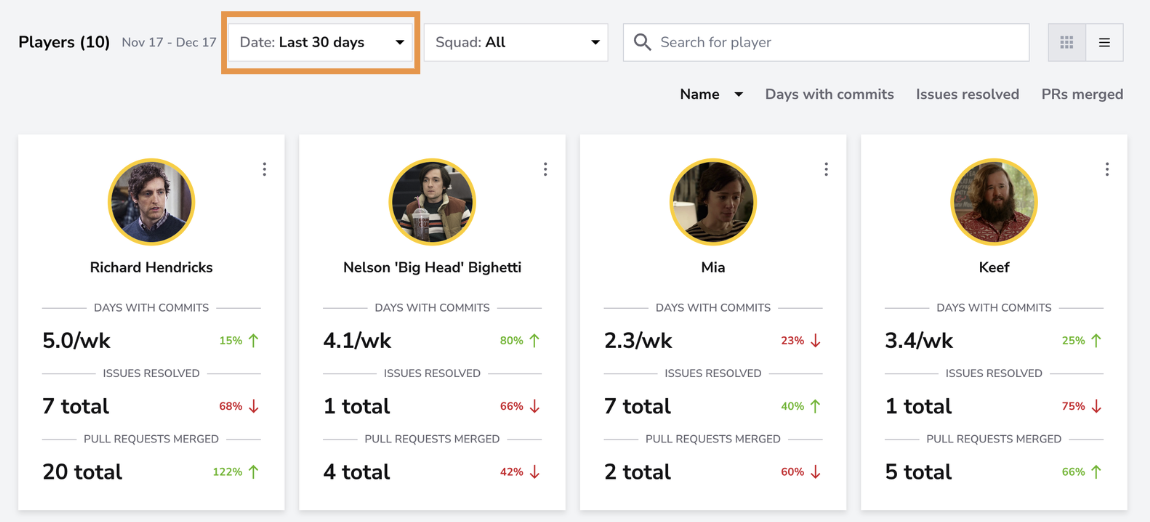
Use the Date Filter to focus on a specific timeframe (e.g., "This Month").
Apply the Squad Filter to view players in a particular squad.
Use the Search Bar to locate a specific player.
User interface:
Table View
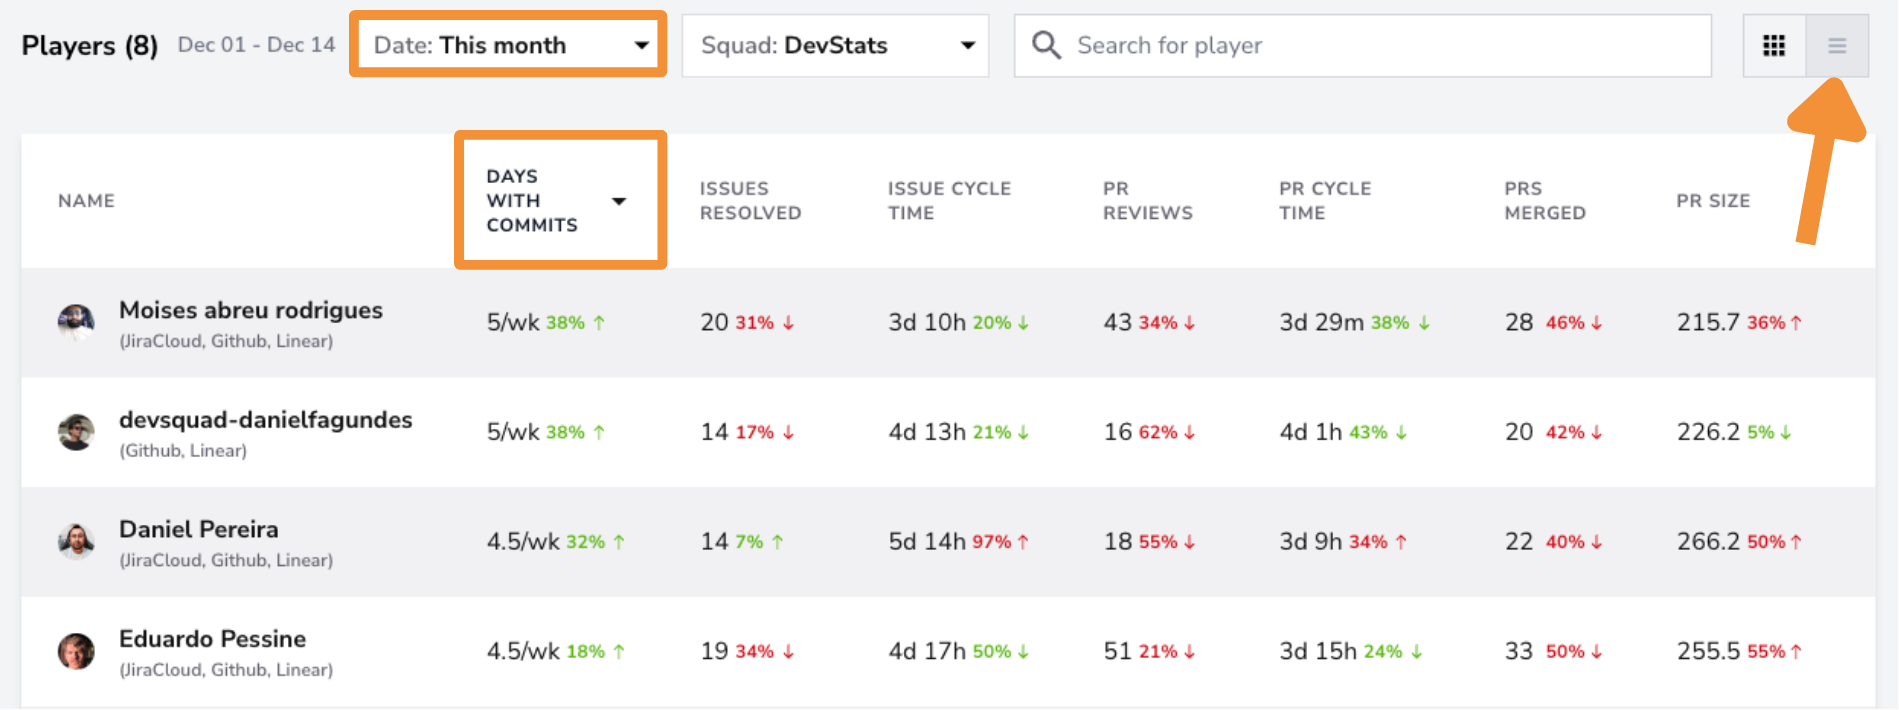
The Table View provides a more detailed, spreadsheet-like presentation of player metrics, making it easier to compare data across contributors. It includes:
The same metrics as the Card View (e.g., Days with Commits, Issues Resolved, PRs Merged).
Additional metrics like PR Cycle Time,PR Reviews, and PR Size.
Sorting:
Click any column heading (e.g., "PR Cycle Time" or "PR Size") to sort players by that metric.
Filters:
Use the Date Filter to focus on a specific timeframe (e.g., "This Month").
Apply the Squad Filter to view players in a particular squad.
Use the Search Bar to locate a specific player.
User interface:
Player Profiles
Clicking on a player's name brings up their Player Profile, which offers a deep dive into their individual performance. This page is divided into two main sections:
Key Metrics
Days with Commits, Issues Resolved, PRs Merged, and PR Reviews: Displayed as a summary on the left, with percentage trends over the selected period.
Additional Insights
Investment Profile: A breakdown of time spent on various types of work (e.g., Features, Bugs, Enhancements).
Language Breakdown: A pie chart showing the languages a player has worked with during the selected period.
Contribution Volume: A graph showing the total contributions over a day, week, or month.
Activities by Type: Tracks contributions such as commits, PR reviews, and issue comments over time.
Filters:
You can change the Date Range or adjust the view (Day, Week, Month) to analyze performance over different timeframes.
User interface:
Metrics
Days With Commits
Shows how frequently the player commits code per week. Helps identify coding consistency and engagement over time.
Issues Resolved
Total number of issues closed by the contributor. Reflects delivery of tasks, bug fixes, and feature completion.
Issue Cycle Time
The average time it takes for an issue to move from start to completion. Useful for understanding efficiency and workflow speed.
PR Reviews
Number of pull requests the developer reviewed. Indicates collaboration level and contribution to code quality.
PR Cycle Time
Measures how long, on average, a player’s pull requests take from creation to merge. Helps identify delays in development or review.
PRs Merged
Total number of pull requests merged. Shows throughput and contribution volume.
PR Size
Average size of pull requests submitted by the player. Smaller PRs tend to be easier to review and merge.
Filters
The Date Filter allows you to select the time window for the activity metrics displayed on each player card.
Use the Squad Filter to view players from a specific squad or select All to see contributors across the entire organization.
This filter is useful when you want to compare activity levels within the same team or identify differences across squads.
Use the Player Search Bar to quickly find a specific contributor by name.
As you type, the list filters dynamically, showing only the players that match your query.
This is especially useful for:
Large squads
Quickly accessing a player during 1:1s
Verifying individual activity trends
Coaching and reviewing contributors individually
Use the Sort Options to reorder the players based on:
Name
Days with commits
Issues resolved
PRs merged
You can sort each metric in ascending or descending order, making it easier to highlight top contributors, identify low-activity patterns, or spot outliers who may need support.
You can switch between Grid View and List View using the toggle button in the top-right corner of the Players page.
Grid View shows each player as an individual card with their key activity metrics.
List View displays a table-style layout, allowing easier comparison across metrics such as days with commits, issues resolved, PR cycle time, PR reviews, PR size, and more.
This toggle makes it simple to choose the most convenient format depending on whether you want a high-level visual overview or a detailed, side-by-side comparison.
Player Detail View
Clicking on any player opens the Player Detail View, a dedicated page that provides a deeper look into that individual’s activity and contribution patterns.
This view includes:
Speed metrics such as PR Cycle Time and Issue Cycle Time
Process indicators like days with commits, issues resolved, and PRs merged
Collaboration metrics including PR reviews, comments, and PR size
Visual breakdowns of the player’s deliverables, languages used, contribution volume, and activity types over time
Use this detailed view to better understand how each contributor works, where they spend their time, and how their activity evolves throughout the selected timeframe.