Player Detail View Overview
Clicking on any player on the Player Page opens the Player Detail View, a dedicated page that provides a deeper look into that individual’s activity and contribution patterns.
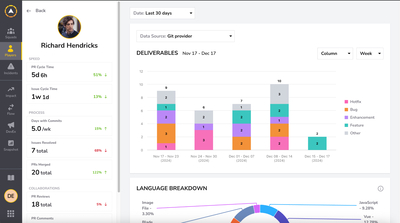
This view includes:
- Speed metrics such as PR Cycle Time and Issue Cycle Time
- Process indicators like days with commits, issues resolved, and PRs merged
- Collaboration metrics including PR reviews, comments, and PR size
- Visual breakdowns of the player’s deliverables, languages used, contribution volume, and activity types over time
Use this view to understand how each contributor works, where they spend their time, and how their activity evolves throughout the selected timeframe. It is especially useful during 1:1s, coaching conversations, and squad health reviews.
This page is not intended for micromanagement. Player-level metrics should never be used for policing productivity. Instead, they provide context, support coaching, and help identify opportunities for collaboration, balance, and growth.
At a Glance: Player Metrics
On the left side of the screen you’ll see the player’s core metrics, grouped into three sections:
- Speed:
- PR Cycle Time – How long it takes, on average, for this player's pull requests to go from creation to merge/deploy.
- Issue Cycle Time – How long it takes for issues they work on to be completed.
- Process:
- Days With Commits – How frequently they commit code per week.
- Issues Resolved – How many issues they closed in the selected period.
- PRs Merged – How many of their PRs were merged.
- Collaborations:
- PR Reviews – How many reviews they've performed.
- PR Comments – How often they comment on PRs.
- PR Size – Average size of their pull requests.
Each metric also shows a trend indicator (percentage up or down) compared to the previous period, helping you quickly spot improvement or potential risks.
Main Metrics
Deliverables
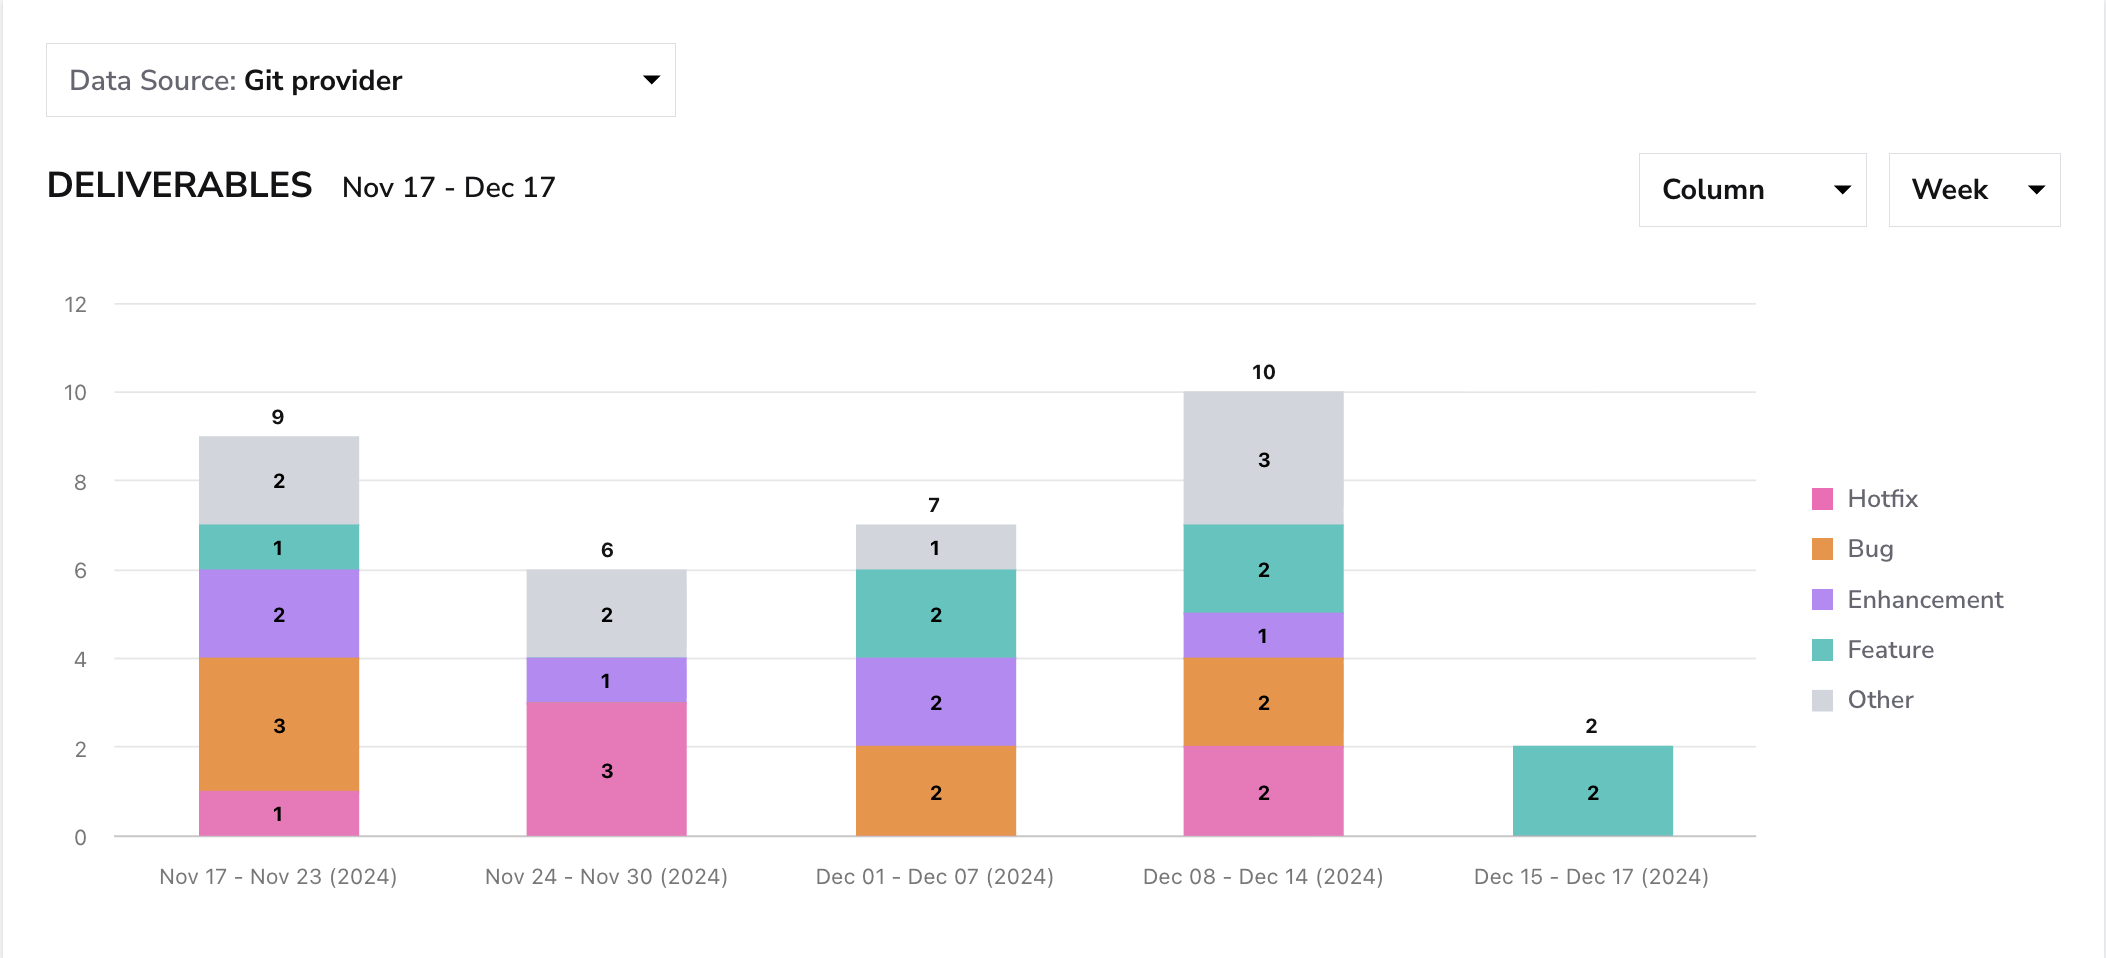
The Deliverables chart shows the number and type of work items the player completed during the selected timeframe.
You can filter the chart by Data Source, choosing between:
- Git provider: counts work derived from PRs.
- Project management: counts work derived from issues, tickets, or tasks in your PM tool
Switching between these sources allows you to compare code-based contributions with planned work tracked in your project system.
Additional customization options include:
- Chart type: Column or Line
- Time bucket: Day, Week or Month
Deliverables are grouped by type, such as: Hotfix, Bug, Enhancement, Feature, Other.
This view helps you understand how a player’s efforts are distributed across feature development, maintenance, and issue resolution.
Language Breakdown
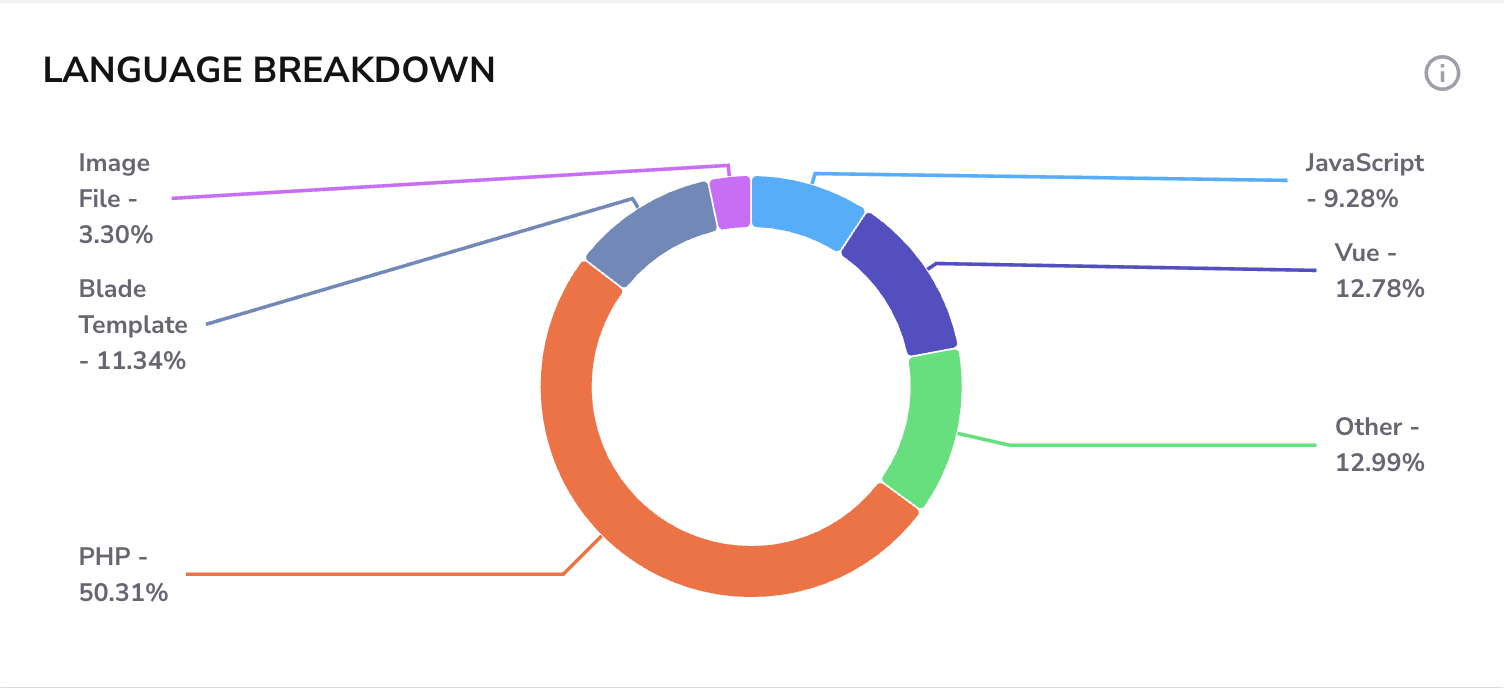
This donut chart visualizes which programming languages or file types the player worked with.
Common examples include:
- PHP
- JavaScript
- Vue
- Templates
- Image files
- Other file categories
This view helps teams:
- Identify a player’s primary tech stack
- Spot opportunities for pairings, mentorship, or technical growth
- Understand cross-team expertise
Contribution Volume
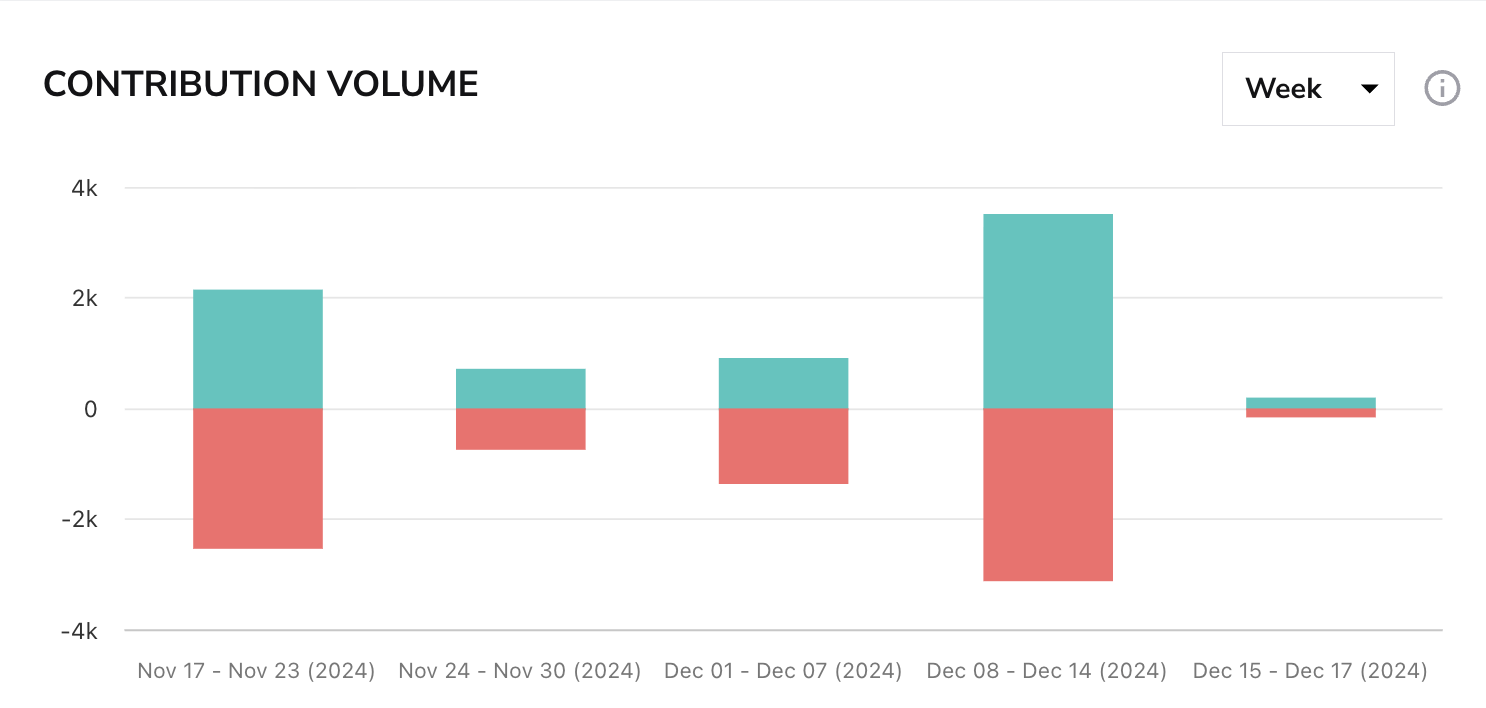
This chart displays the volume of code added or removed over time.
You can toggle between:
- Day
- Week
- Month
Use it to spot:
- Refactoring periods
- High-output intervals
- Changes in workload or contribution intensity
It provides context for whether someone is doing feature work, cleanup, or architectural changes.
Activities by Type
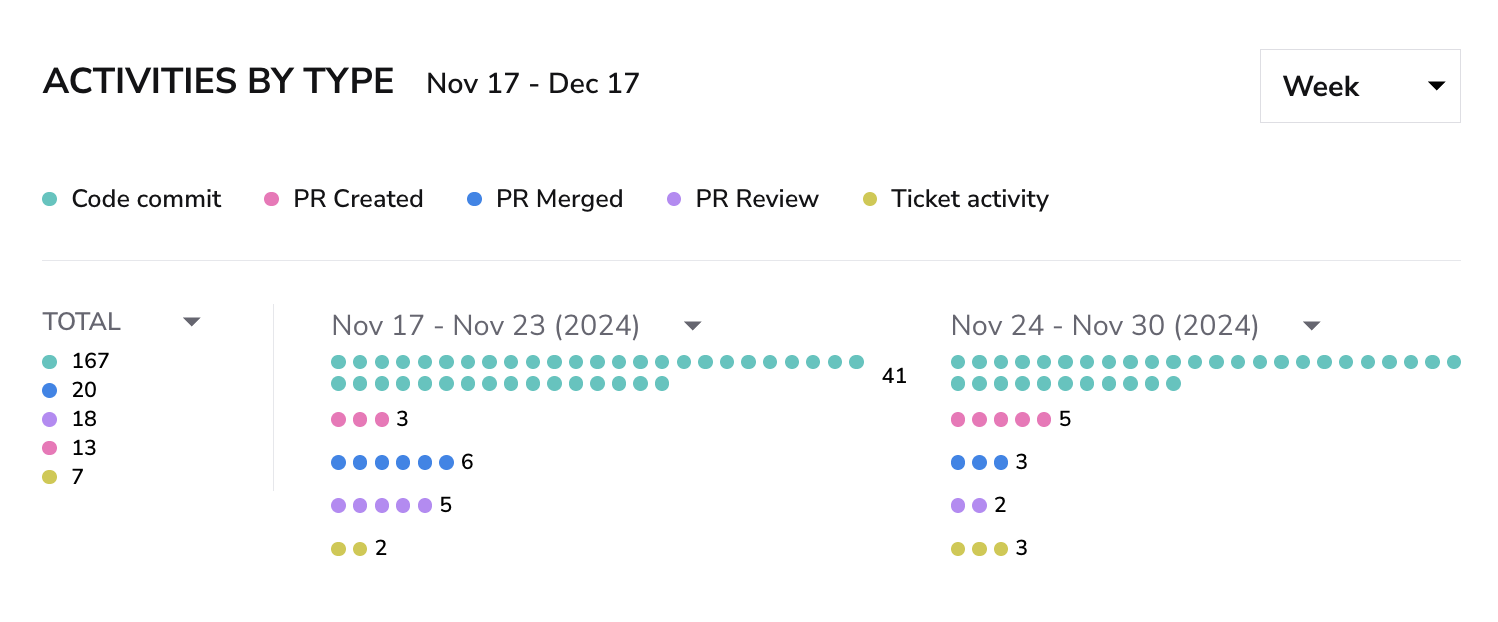
This section breaks down all activity types the player performed across the selected period.
Activity categories include:
- Code commits
- PRs created
- PRs merged
- PR reviews
- Ticket activity
Each time bucket displays:
- Dot charts representing each activity
- Totals
- A dropdown to switch between Day / Week / Month
This view gives a complete timeline of how the player is working, collaborating, and interacting with the codebase.
Sidebar Metrics
Days with Commits
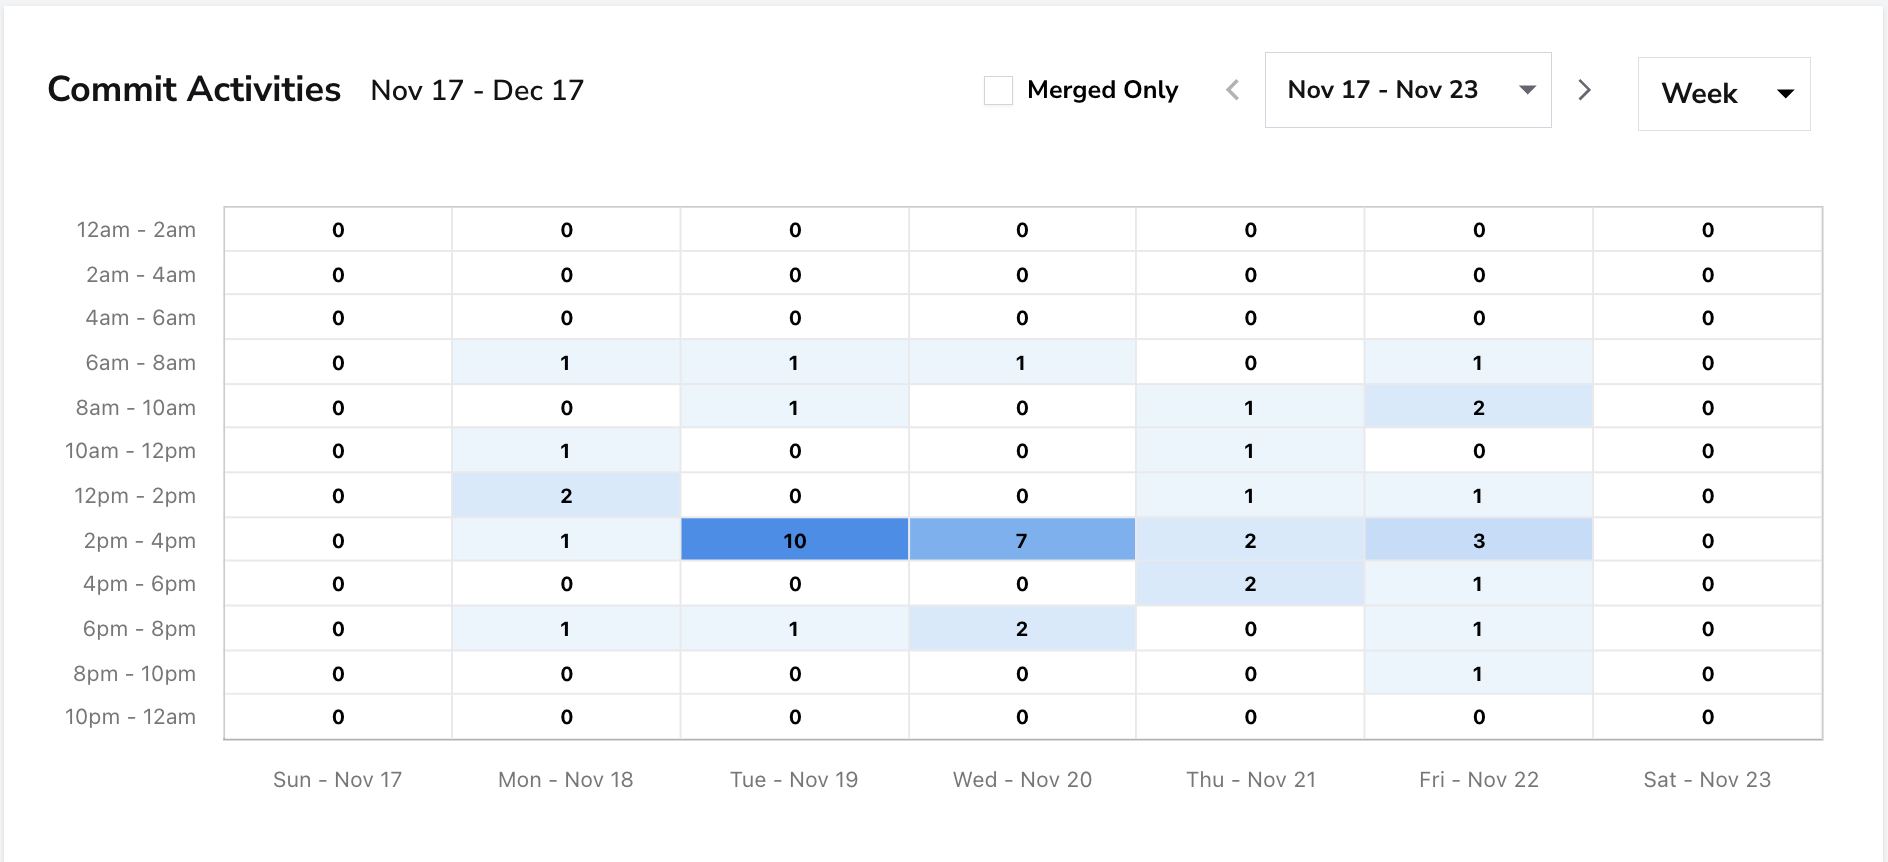
Shows when the player commits code throughout the week, revealing activity patterns such as peak hours and most active days.
Helps you understand consistency, work rhythm, and natural collaboration windows.
You can filter for merged commits only, adjust the date range, and switch the time view (day, week or month).
This metric is not meant for micromanagement, but for identifying patterns and opportunities to support the developer.
Summary
The Player Detail View provides a detailed view of an individual developer’s contributions, combining high-level performance metrics with deeper activity insights. The sidebar highlights key indicators across speed, process, and collaboration, such as PR cycle time, issue cycle time, commit frequency, issues resolved, PRs merged, reviews, comments, and PR size.
The main area displays visual and interactive breakdowns of the player’s work, including deliverables over time, language usage, contribution volume, activity types, and commit activity patterns. You can also explore detailed lists of the player’s pull requests, issues, and reviews.
These insights help identify strengths, workload patterns, and opportunities for support or collaboration. They are not intended for micromanagement, but to foster better coaching, workload balance, and team effectiveness.