Docs
Welcome to DevStats Docs
Getting Started
  • Get started in 10 minutes
  • Integrations
    • GitHub
      • Troubleshooting
    • Github Copilot
    • GitHub Projects
    • Claude
    • GitLab
    • GitLab Self-Managed
    • Bitbucket
      • Troubleshooting
    • Bitbucket Data Center
    • Azure Repos
      • Troubleshooting
    • Azure Boards
    • Jira Cloud
    • Jira Data Center
    • Linear
    • ClickUp
    • Incident.io
  • Settings
    • Workspace Settings
      • Company Profile
      • Access Management
      • Players
      • Timezone
      • Projects
      • Repositories
    • Reports Configuration
      • Issue Tracker Rules
      • Git rules
      • Deploys
      • Incidents
      • Investment Profile
      • Allocation
      • Engineering Investment
  • Guides
    • Guide: Detecting and Managing Technical Debt
    • Guide: Productivity and Collaboration
    • Guide: Engineering Velocity
    • Guide: Code Quality
Use Cases
  • Improve PR Flow & Ship Faster
    • Pull request insights
    • Reducing pull request cycle time
    • Review code faster
  • Real-Time Blocker Detection
    • Improve your squad's focus
  • Improve processes & sprints
    • Apply Aging Insights to Daily Meetings
    • Improve Predictability through Planning Accuracy
  • Align Engineering Investment with Business Needs
    • How-to: Implement the 60-20-20 Rule for Balanced Engineering Investment
  • DORA & Snapshot Metrics
    • Tracking incidents
  • Benchmarking
Metrics & Definitions
  • Benchmarks
  • PR Cycle Time
    • How-To: Optimize PR Cycle Time
    • How-to: Write PRs That Get Reviewed Faster
  • Issue Cycle Time
    • 5 Tips to Improve Issue Cycle Time
    • How-To: Measuring Hotfix and \"In Progress\" Time by Squad
  • DORA
  • AI Usage
  • Aging Branches
  • Aging Issues
  • Engineering Investment
    • How-To: Configure the Engineering Investment Report
    • How-To: Implement the 60-20-20 Rule for Balanced Engineering Investment
  • Activity Heatmap
    • How-To: Protect Developer Focus Times with the Activity Heatmap
  • Investment Profile
    • How-To: Configure the Investment Profile Report
    • How-To: Monitor Task Distribution for a Balanced Workload
  • Allocation
    • How-To: Configure the Allocation Report
    • How-To: Maintain Balance Across Allocation Types
  • Sprint Progress Summary
  • Planning Accuracy
    • How-to: Improve Predictability through Planning Accuracy
  • Sprints
    • How-To: Detect Technical Debt and Bottlenecks?
    • How-To: Monitor Team Health and Capacity
  • Work Breakdown
    • How-To: Detect Patterns in Development Time
  • Code Review
    • How-To: Balance Review Workloads Using the Code Review and PR Cycle Time Dashboards
  • Open PRs
    • How-To: Keep PR Review Times Low and Identify Bottlenecks
  • Deploy
    • Guide: Submit Deployment Data Using the DevStats API
    • How-To: Optimize Your Deployment Process
  • Throughput
    • How-To: Detect Technical Debt with the Throughput Dashboard
  • Daily WIP
  • Speed
  • Productivity
  • Collaboration
  • AI Reports
    • Channels
Features
  • Players
    • Player Detail View
  • Squads
Tools
  • MCP
    • Claude
    • ChatGPT
    • Custom
  • DevStats API
    • Getting Started: Create API Token
    • Deploy API
    • Incident API
    • Player API
    • User API
  • Incidents
    • Branch Prefix Detection
    • Incident Management
    • Incident.io
    • Guide: Create and Update Incidents Using the DevStats API
    • Datadog
    • PR Rollback
Docs/Getting Started/Settings

Settings

The settings documentation covers the following items:

Workspace Settings

Manage key configurations that define how your organization operates.

Reports Configuration

Configure how key data sources integrate and behave within your workspace.

How to access the settings

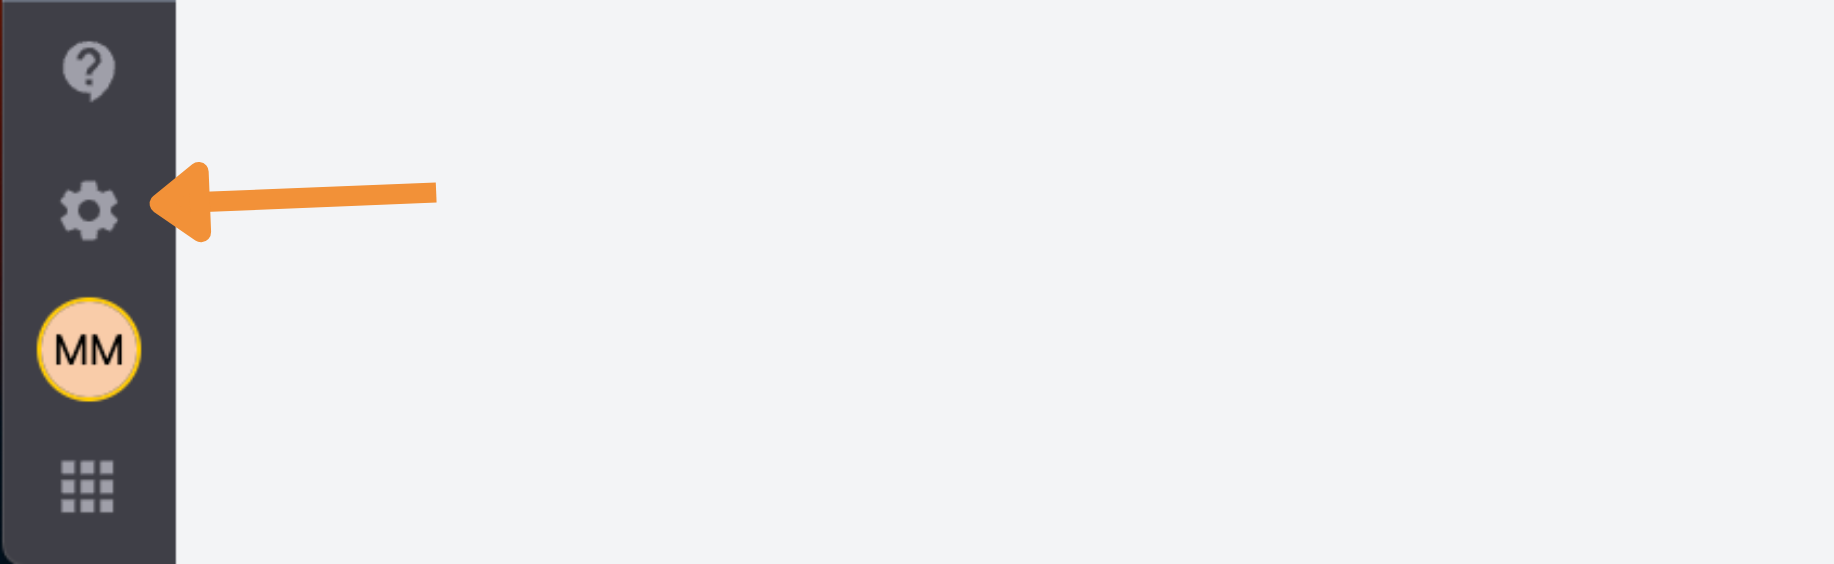
To access the settings, click on the gear icon above your user profile icon.

Settings gear icon location
PreviousIncident.ioNextWorkspace Settings
On this page
  • How to access the settings