What is the Work Breakdown Feature?
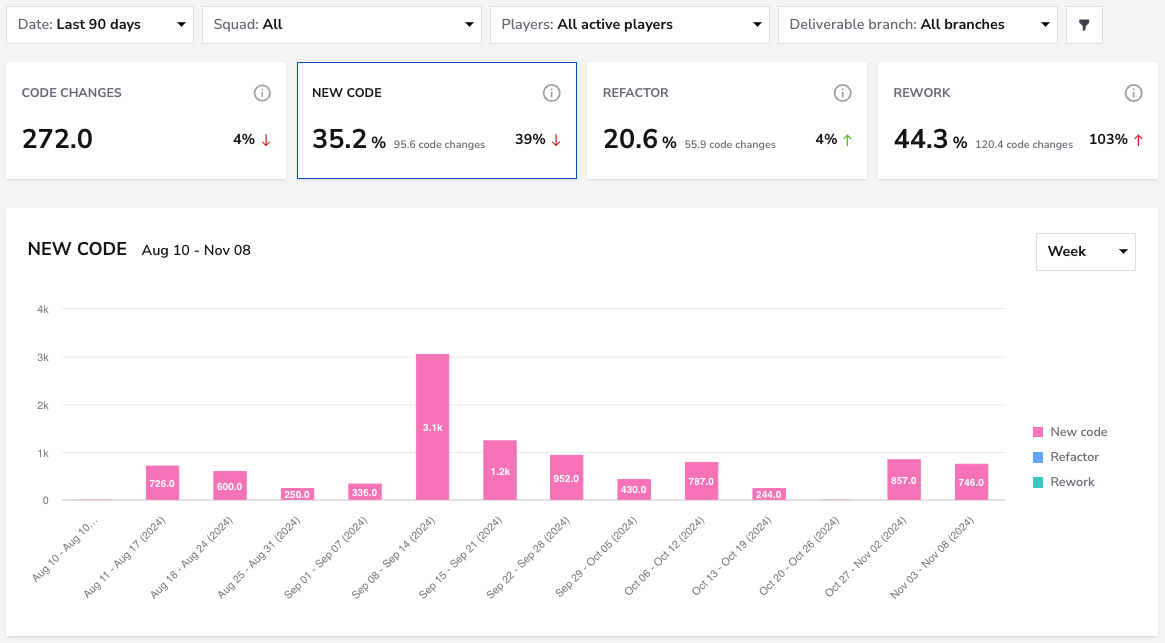
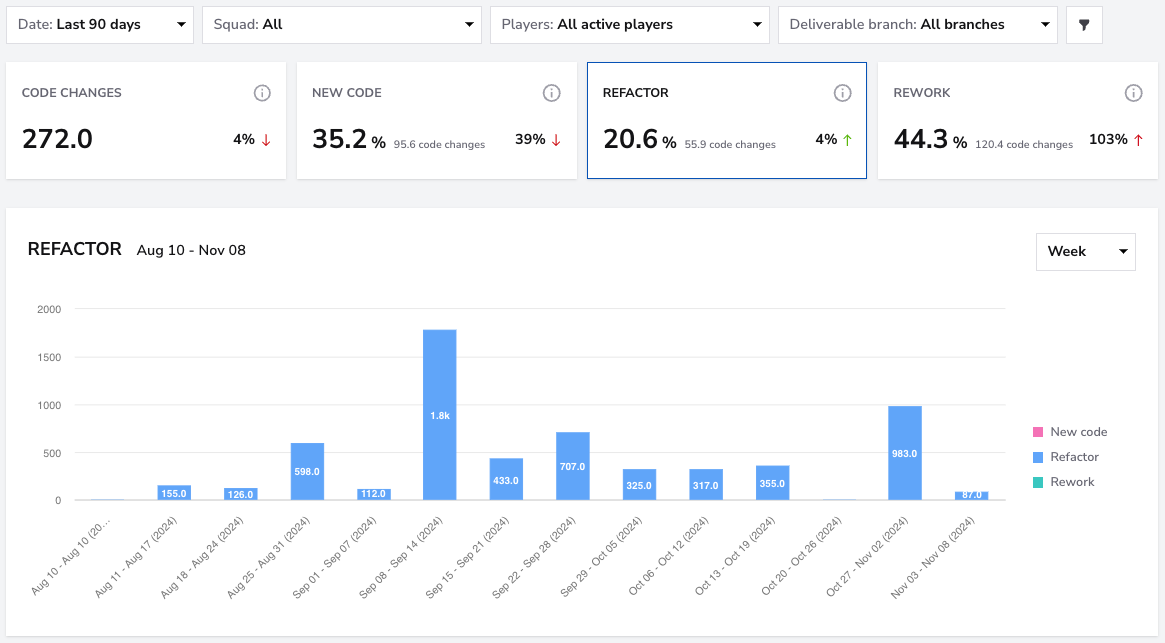
The Work Breakdown dashboard is designed to give teams detailed insights into the types of code changes made over a set period, breaking down work into New Code,Refactor, and Rework. This dashboard helps teams assess their focus areas and manage their development practices effectively.
Metrics
Code Changes
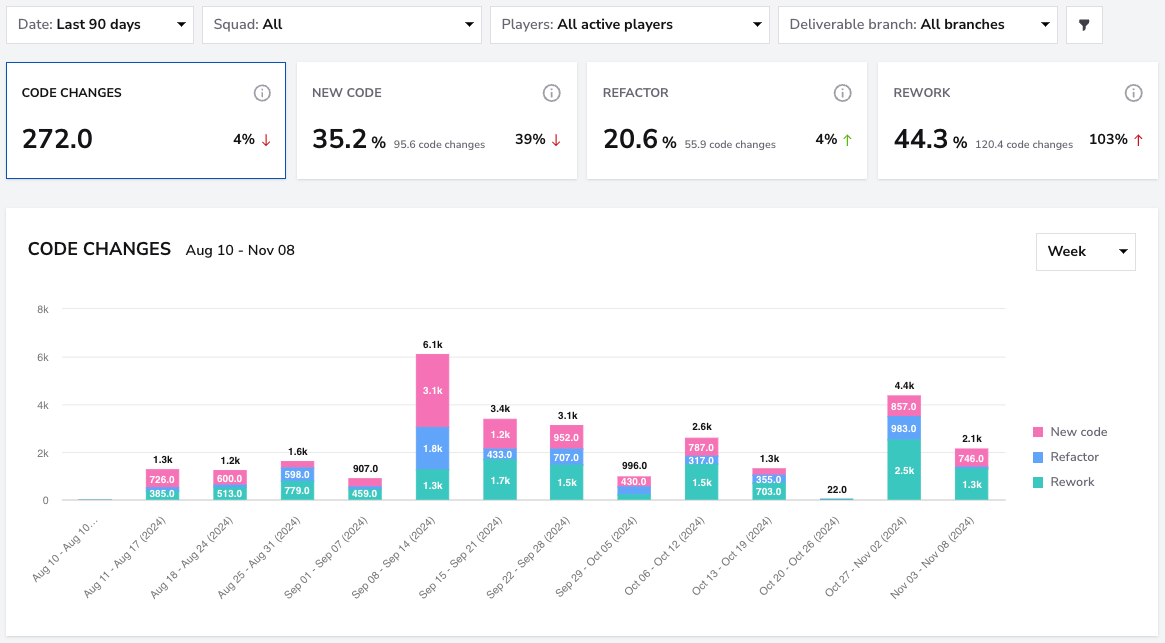
- What: The card displays the average number of lines of code modified per change during a specific period, while the chart shows the total sum of all code modifications made in that timeframe, encompassing all types of code activities.
- Why it matters: Provides a comprehensive view of the team's overall coding activity, helping assess productivity levels and the scale of development work.
- How to use it: Compare code changes over different periods to track development trends and understand fluctuations in activity.
- User interface:

Filters
Use the Squad Filter to view Work Breakdown metrics for individual squads. If you want a broader overview of all teams, select the "All" filter to see the breakdown across all squads at once.
The Date Filter allows you to view data for specific time periods. You can filter for the last month, quarter, or 365 days. If you need more granular control, you can filter by a custom date range.
Use the Players Filter to focus on individual team members or a specific group within your squad. You can select one member for a detailed view, a group of team members if they form a sub-squad, or all team members for an overview of the entire squad's Work Breakdown metrics.
Use the Repository Filter to focus on specific repositories or view Work Breakdown metrics across all repositories. This filter is especially valuable for identifying trends and analyzing development focus in individual codebases, which is particularly helpful when managing multiple repositories.
Use the Issue Type Filter to analyze Work Breakdown metrics for specific types of issues, such as Features, Bugs, Enhancements, or Hotfixes. This filter allows teams to monitor the distribution and focus of work across different issue types, providing insights into development priorities and workflow balance.
Tracking work breakdown by issue type helps identify trends, particularly in critical areas like bug fixes and hotfixes. This ensures that these are addressed promptly to maintain code quality and product stability.
Controls
Select Code Changes, New Code, Refactor, or Rework to use Controls for that metric. Each card offers Average, Mode, and Percentile under Statistical Measure. Chart Settings and PR Cycle Time Stages are not available in this report.
Click the adjustments button on the Controls bar and select Save after choosing your options. See the Controls guide for details.
Explore Best Practices
Conclusion
Understanding and leveraging the Work Breakdown Metric enables teams to balance their development efforts, maintain high code quality, and optimize their workflow. By regularly monitoring the proportion of new code, refactoring, and rework, teams can proactively address technical debt, refine their processes, and enhance collaboration for more efficient and high-quality code delivery.