Overview
Benchmarking is one of the most effective ways for engineering teams to understand where they stand today and where they should focus next. DevStats combines DORA research with anonymized data from thousands of engineering organizations to create performance tiers for core engineering metrics.
The Benchmarks Dashboard shows how your team performs across delivery, reliability, planning, code review, throughput, and investment metrics. Each metric is mapped to the Elite, Strong, Fair, or Needs Focus tier, offering a clear and objective view of your current maturity level.
Teams use this report to validate assumptions, challenge blind spots, and set improvement priorities. It reveals where the team is already strong and where attention is needed, making it easier to decide which metrics to improve next.
When to Use This
Use this use case when your team wants to:
- Understand how they compare to high-performing engineering teams
- Identify which areas require the most attention
- Prioritize improvement efforts for the next cycle or quarter
- Create alignment on performance goals based on industry data
- Validate whether current delivery practices are competitive or need adjustment
- Choose metrics to focus on before diving into detailed reports
What You Can Achieve
By using benchmarking during your improvement process, teams can:
- Highlight strengths and celebrate progress
- Quickly spot problem areas that may be slowing down delivery
- Choose one or two metrics to focus on for measurable improvement
- Build realistic expectations with leadership and stakeholders
- Move discussions from “we think” to “the data shows”
- Track their evolution over time as they advance through benchmark tiers
How Teams Apply This Use Case
1. Start with the Benchmarks Dashboard
Teams begin by reviewing where each metric falls relative to the Elite, Strong, Fair, and Needs Focus performance tiers.
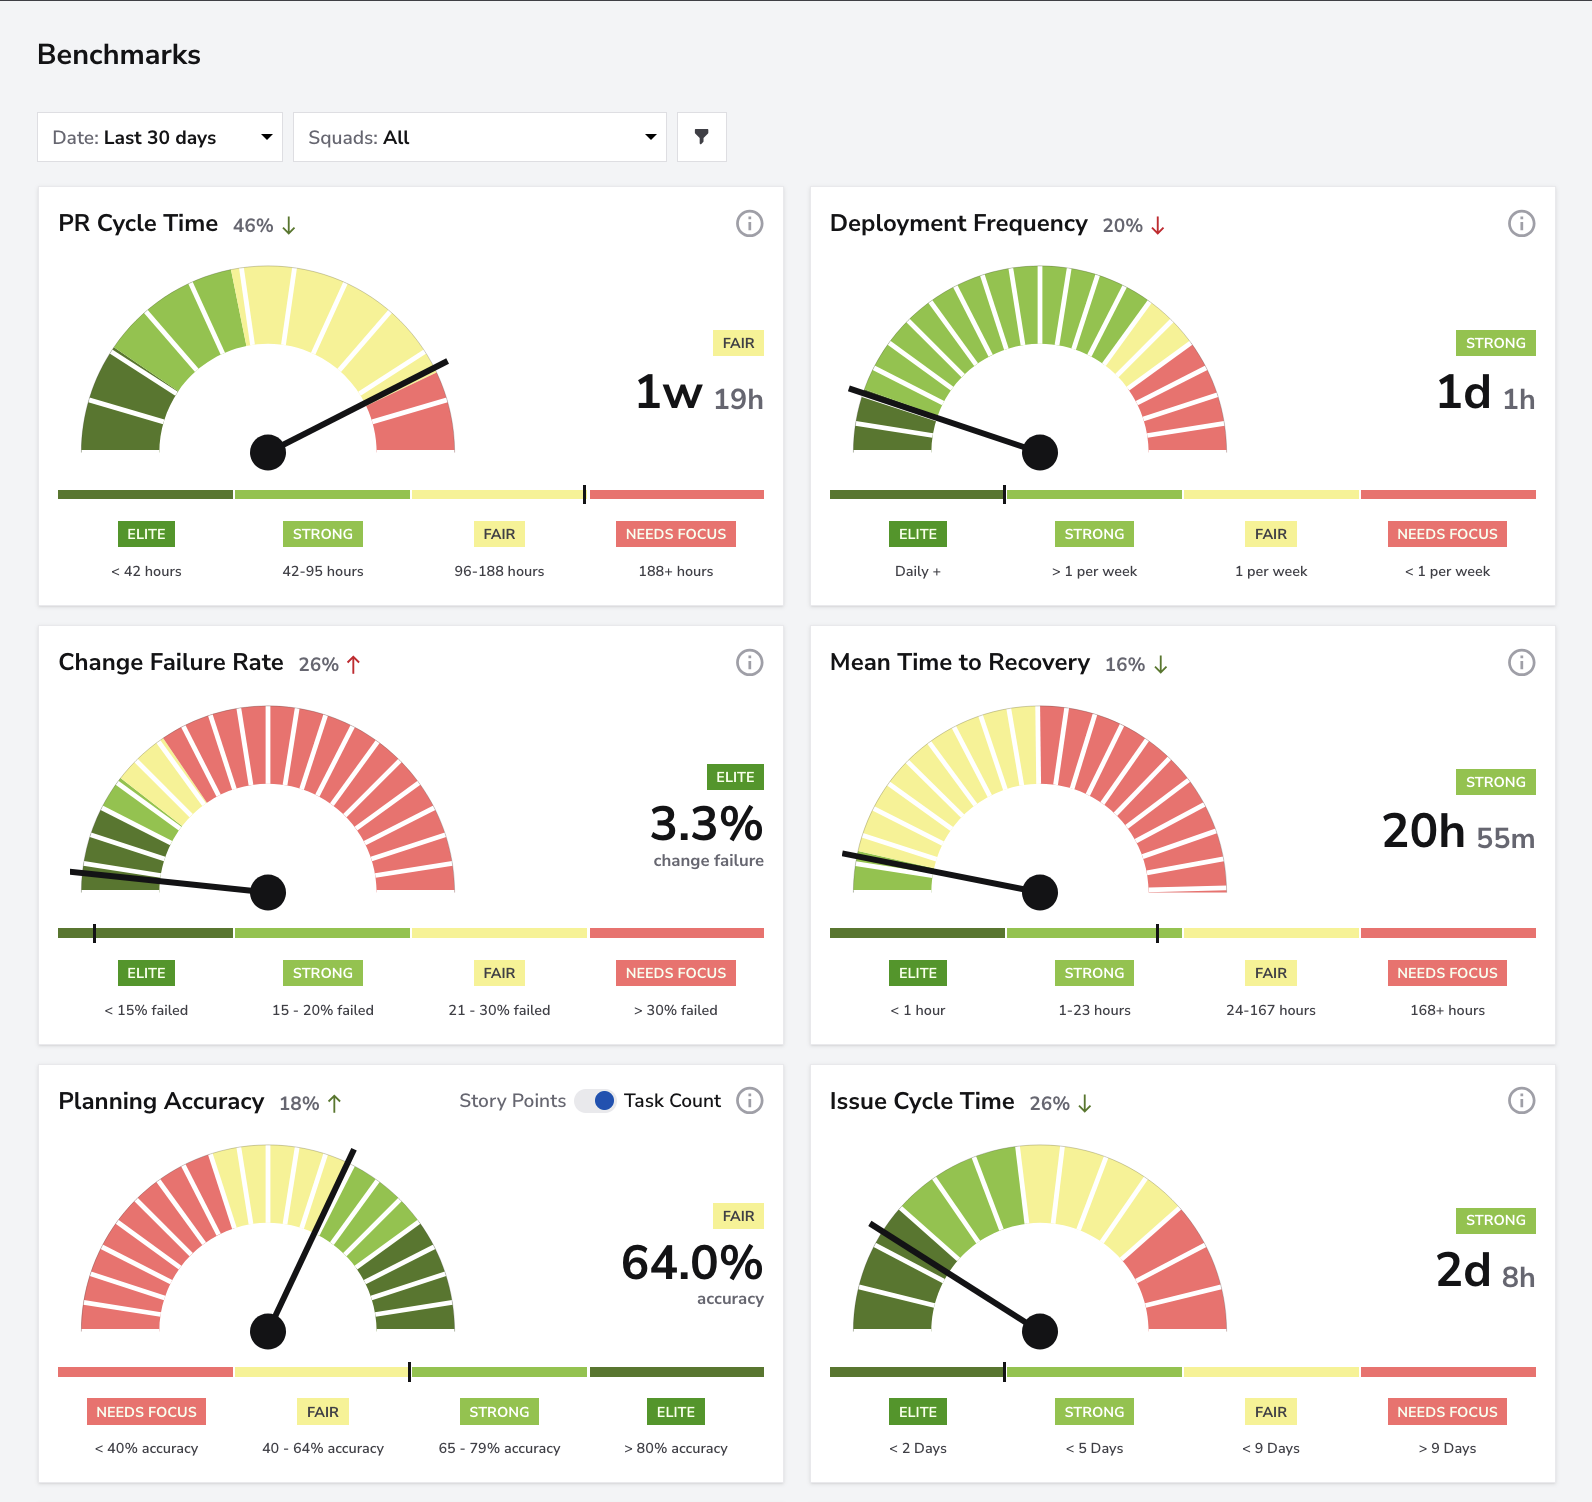
This gives an immediate, holistic view of overall engineering health.
2. Identify Focus Areas
Benchmarking helps highlight which metrics deserve the most attention, whether it's long PR reviews, large pull requests, low planning accuracy, frequent failures in production, or slow delivery cycles.
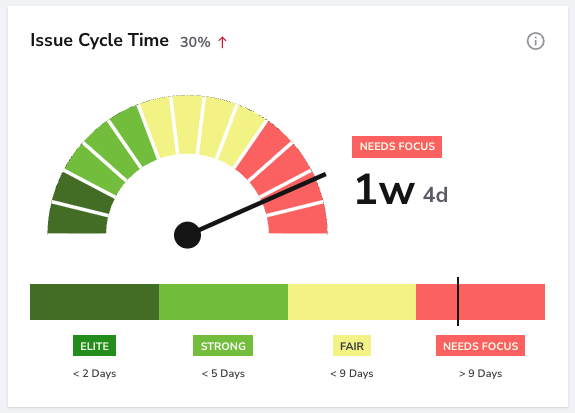
In this example, the issue cycle time is trending upward (which is not a good sign for this metric) and falls into the Needs Focus zone, indicating that this metric should be prioritized for investigation and improvement.
3. Choose Metrics for Improvement
Teams commonly select one or two metrics to focus on each quarter. Benchmarking turns these choices into deliberate, data-informed decisions instead of guesswork.
4. Explore Detailed Reports
Once priorities are clear, teams use the corresponding detailed reports (PR Cycle Time, Issue Cycle Time, Planning Accuracy, etc.) to investigate root causes and define improvement strategies.
5. Track Progress Over Time
As improvements are implemented, teams revisit the Benchmarks Dashboard to see whether they’ve advanced a performance tier or narrowed gaps. This creates a clear sense of progress and accountability.
Summary
Benchmarking gives teams a clear, objective picture of how they perform today and which areas will drive the biggest impact if improved. With DevStats, teams move beyond intuition and anchor their improvement efforts in real industry data, helping them advance toward higher performance with clarity and confidence.