Context
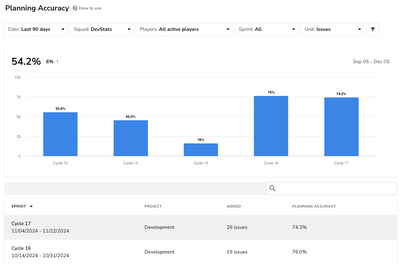
A squad noticed strong fluctuations in sprint delivery rates, from 55% in Cycle 13 down to16% in Cycle 15, followed by a consistent recovery above74% in Cycles 16 and 17. By leveraging the Planning Accuracy dashboard, the team identified that the drop was associated with unplanned work being added mid-sprint and unclear scope definitions during planning.
How They Used the Dashboard
- Reviewed the last 90 days of Planning Accuracy data filtered by the DevStats squad.
- Identified that low-performing cycles had too many spillovers from previous sprints.
- Adjusted their approach by:Refining the backlog more thoroughly before sprint start.Reducing mid-sprint scope changes.Committing only to work with clear acceptance criteria.
Result
By Cycle 16, Planning Accuracy jumped from16% → 76%, remaining stable above 70% in the following sprints. This improvement translated into better sprint predictability and fewer carried-over issues, aligning planned and completed work more closely.
| Range | Meaning | Action |
|---|---|---|
| Below 60% | Overcommitment; sprint goals too ambitious or unclear. | Reassess scope and refinement quality. |
| ~80% (Ideal) | Balanced; good alignment between planning and execution while maintaining challenge. | Maintain current planning discipline. |
| Near 100% | Possible undercommitment; team may be setting too low or overly safe sprint goals. | Encourage slightly more ambitious planning. |
Key Takeaways
- A Planning Accuracy around 80% indicates a healthy balance between predictability and ambition.
- Consistently low accuracy (<60%) suggests issues in planning or prioritization.
- Near-perfect accuracy might look good on paper but can signal that the team isn’t stretching their capacity or experimenting with improvement opportunities.
- Track trends over time, not just single sprint values, to ensure sustained and realistic delivery patterns.