The AI Usage Dashboard provides insights into how developers are using AI-powered coding assistance across the workspace. It helps administrators and team leads monitor adoption, productivity impact, and trends over time.
Currently, the dashboard supports connections with GitHub Copilot and Claude for Developers.
Metrics
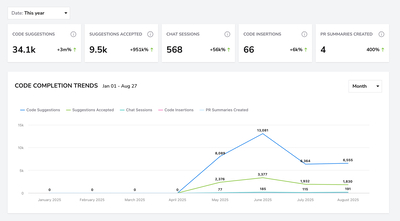
Code Suggestions
What: The total number of AI-generated code completions shown to developers.
Why it matters: Indicates how frequently AI is being leveraged in the coding workflow. A high number means strong Copilot engagement.
How to use it: Monitor growth over time to see if usage is increasing. If numbers are low, encourage developers to enable and try Copilot features.
Suggestions Accepted
What: The number of AI-generated suggestions that developers accepted and inserted into their code.
Why it matters: Reflects how valuable and relevant Copilot’s output is to the team’s work.
How to use it: Compare with “Code Suggestions” to assess adoption. A growing number of acceptances shows improved trust in Copilot
Chat Sessions
What: The total number of AI-powered chat interactions (e.g., asking Copilot for explanations, code help, debugging).
Why it matters: Shows how developers rely on conversational AI support beyond code completions.
How to use it: Use this to measure knowledge-seeking behavior. An increase can highlight reliance on Copilot for problem-solving or onboarding new developer
Code Insertions
What: The number of times code snippets were directly inserted from AI chat into the codebase.
Why it matters: Demonstrates how chat-driven suggestions contribute to actual development work.
How to use it: Monitor this metric to evaluate the effectiveness of Copilot Chat. Low insertions might mean developers use chat for exploration, not direct coding.
PR Summaries Created
What: The number of pull request summaries automatically generated by AI.
Why it matters: Provides insight into how often AI is being used to assist with documenting PRs, helping assess adoption and reliance on AI-driven support in the development workflow.
How to use it: Use this metric to evaluate the effectiveness and usage of PR summary generation. Consistently high numbers may indicate strong adoption, while low numbers could highlight limited awareness or preference for manual documentation.
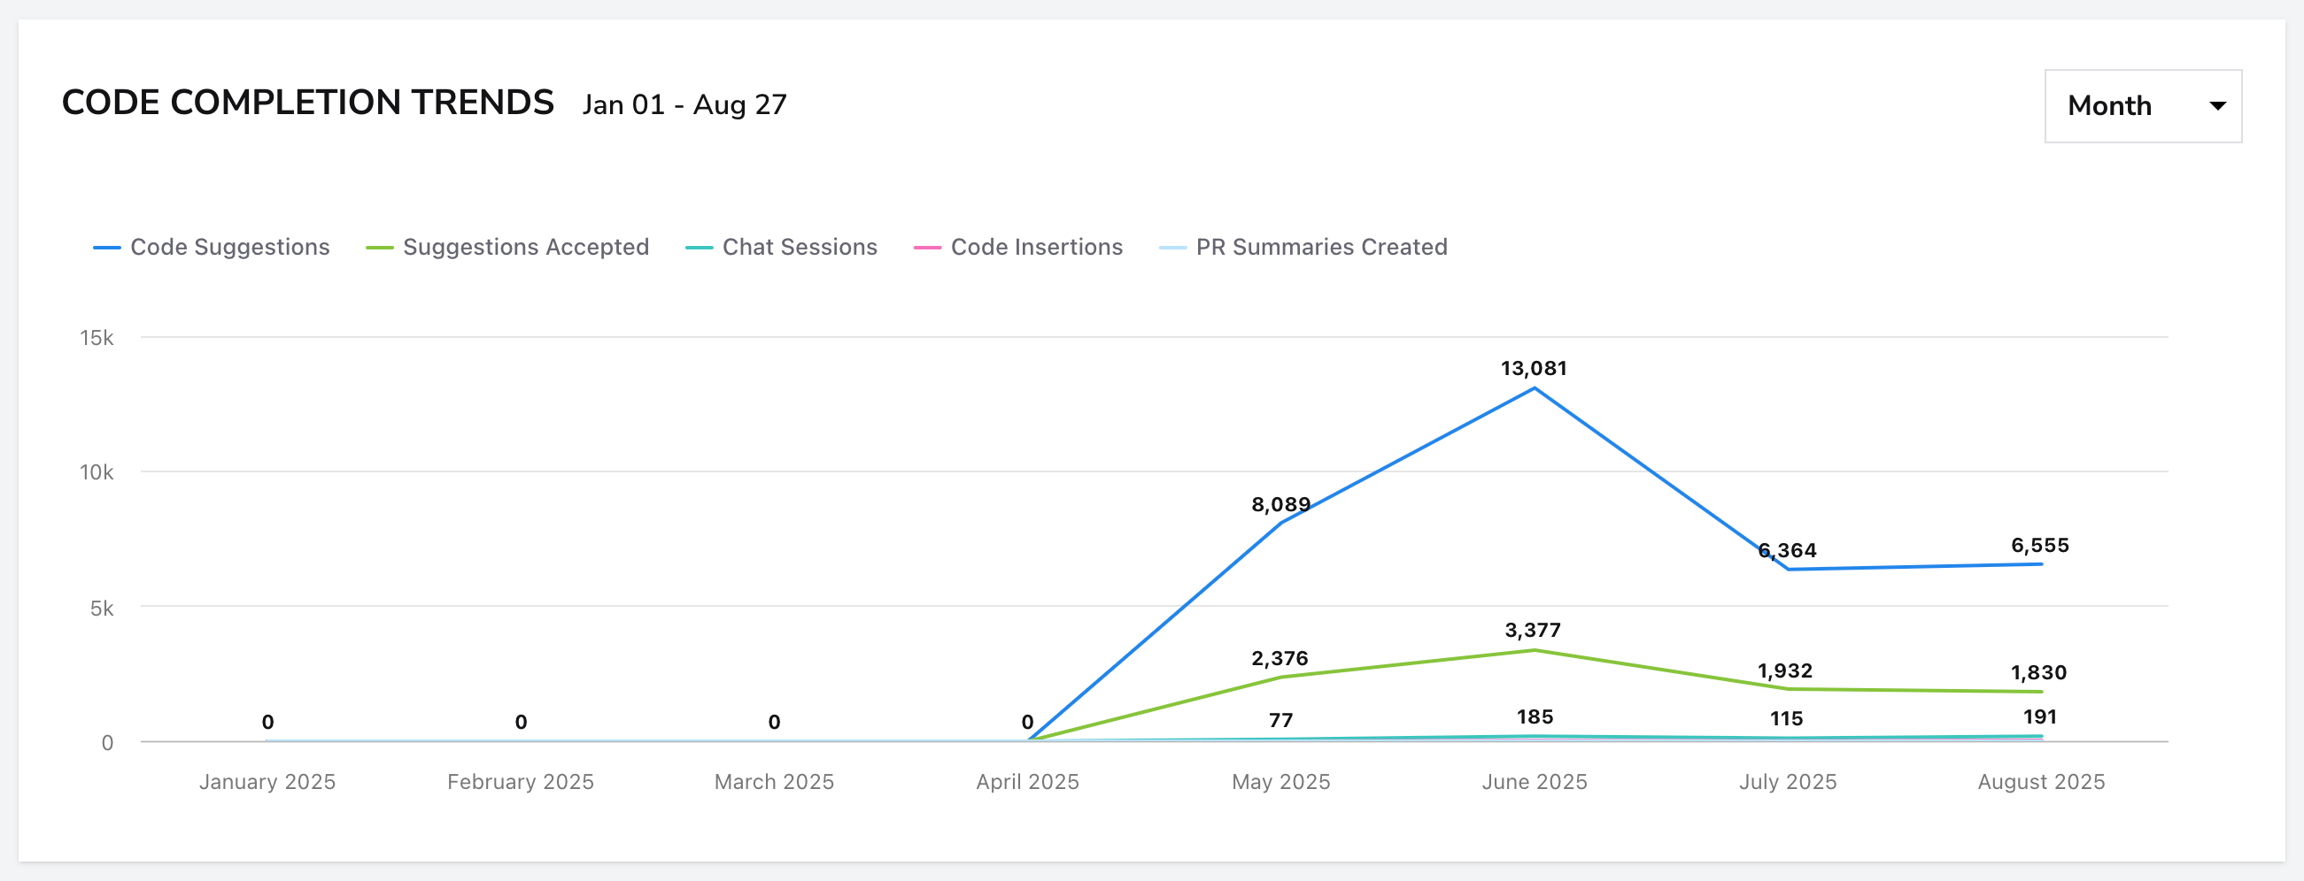
Code Completion Trends (Line Graph)
Displays activity trends over time.
Data can be grouped by Year,Month, and Day (dropdown allows adjusting the granularity).
Lines represent: Blue (Code Suggestions):Total suggestions shown.Green (Suggestions Accepted):Number of accepted suggestions.Teal (Chat Sessions):Number of AI chat interactions.Pink (Code Insertions):Number of insertions made through AI chat.Light Blue (PR Summaries Created): Number of pull request summaries created by AI.
Filter
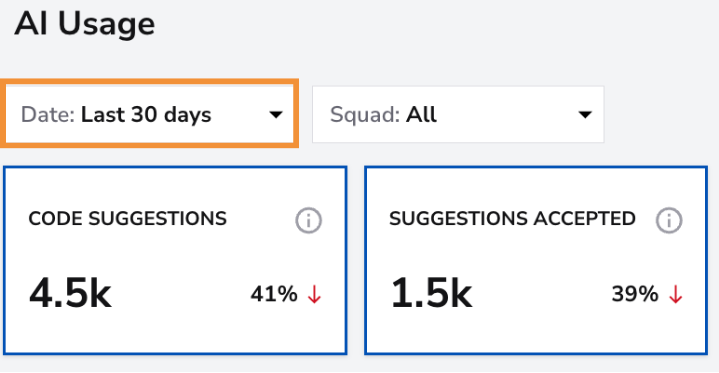
The date filter allows you to adjust the time range of all metrics and charts for focused analysis.
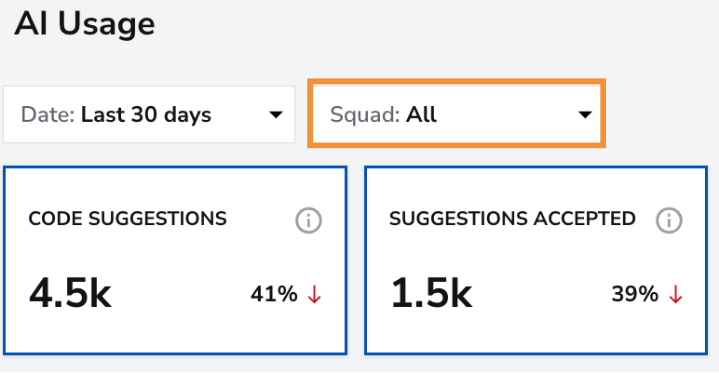
The squadfilter lets you choose whether to view metrics for all squads or drill down into a single squad for deeper insights.