Visibility & Insights
See every contributor's impact, at a glance.
Get a structured overview of individual performance across your entire team. Track commit frequency, issues resolved, and PRs merged per contributor to understand workload distribution and spot coaching opportunities.
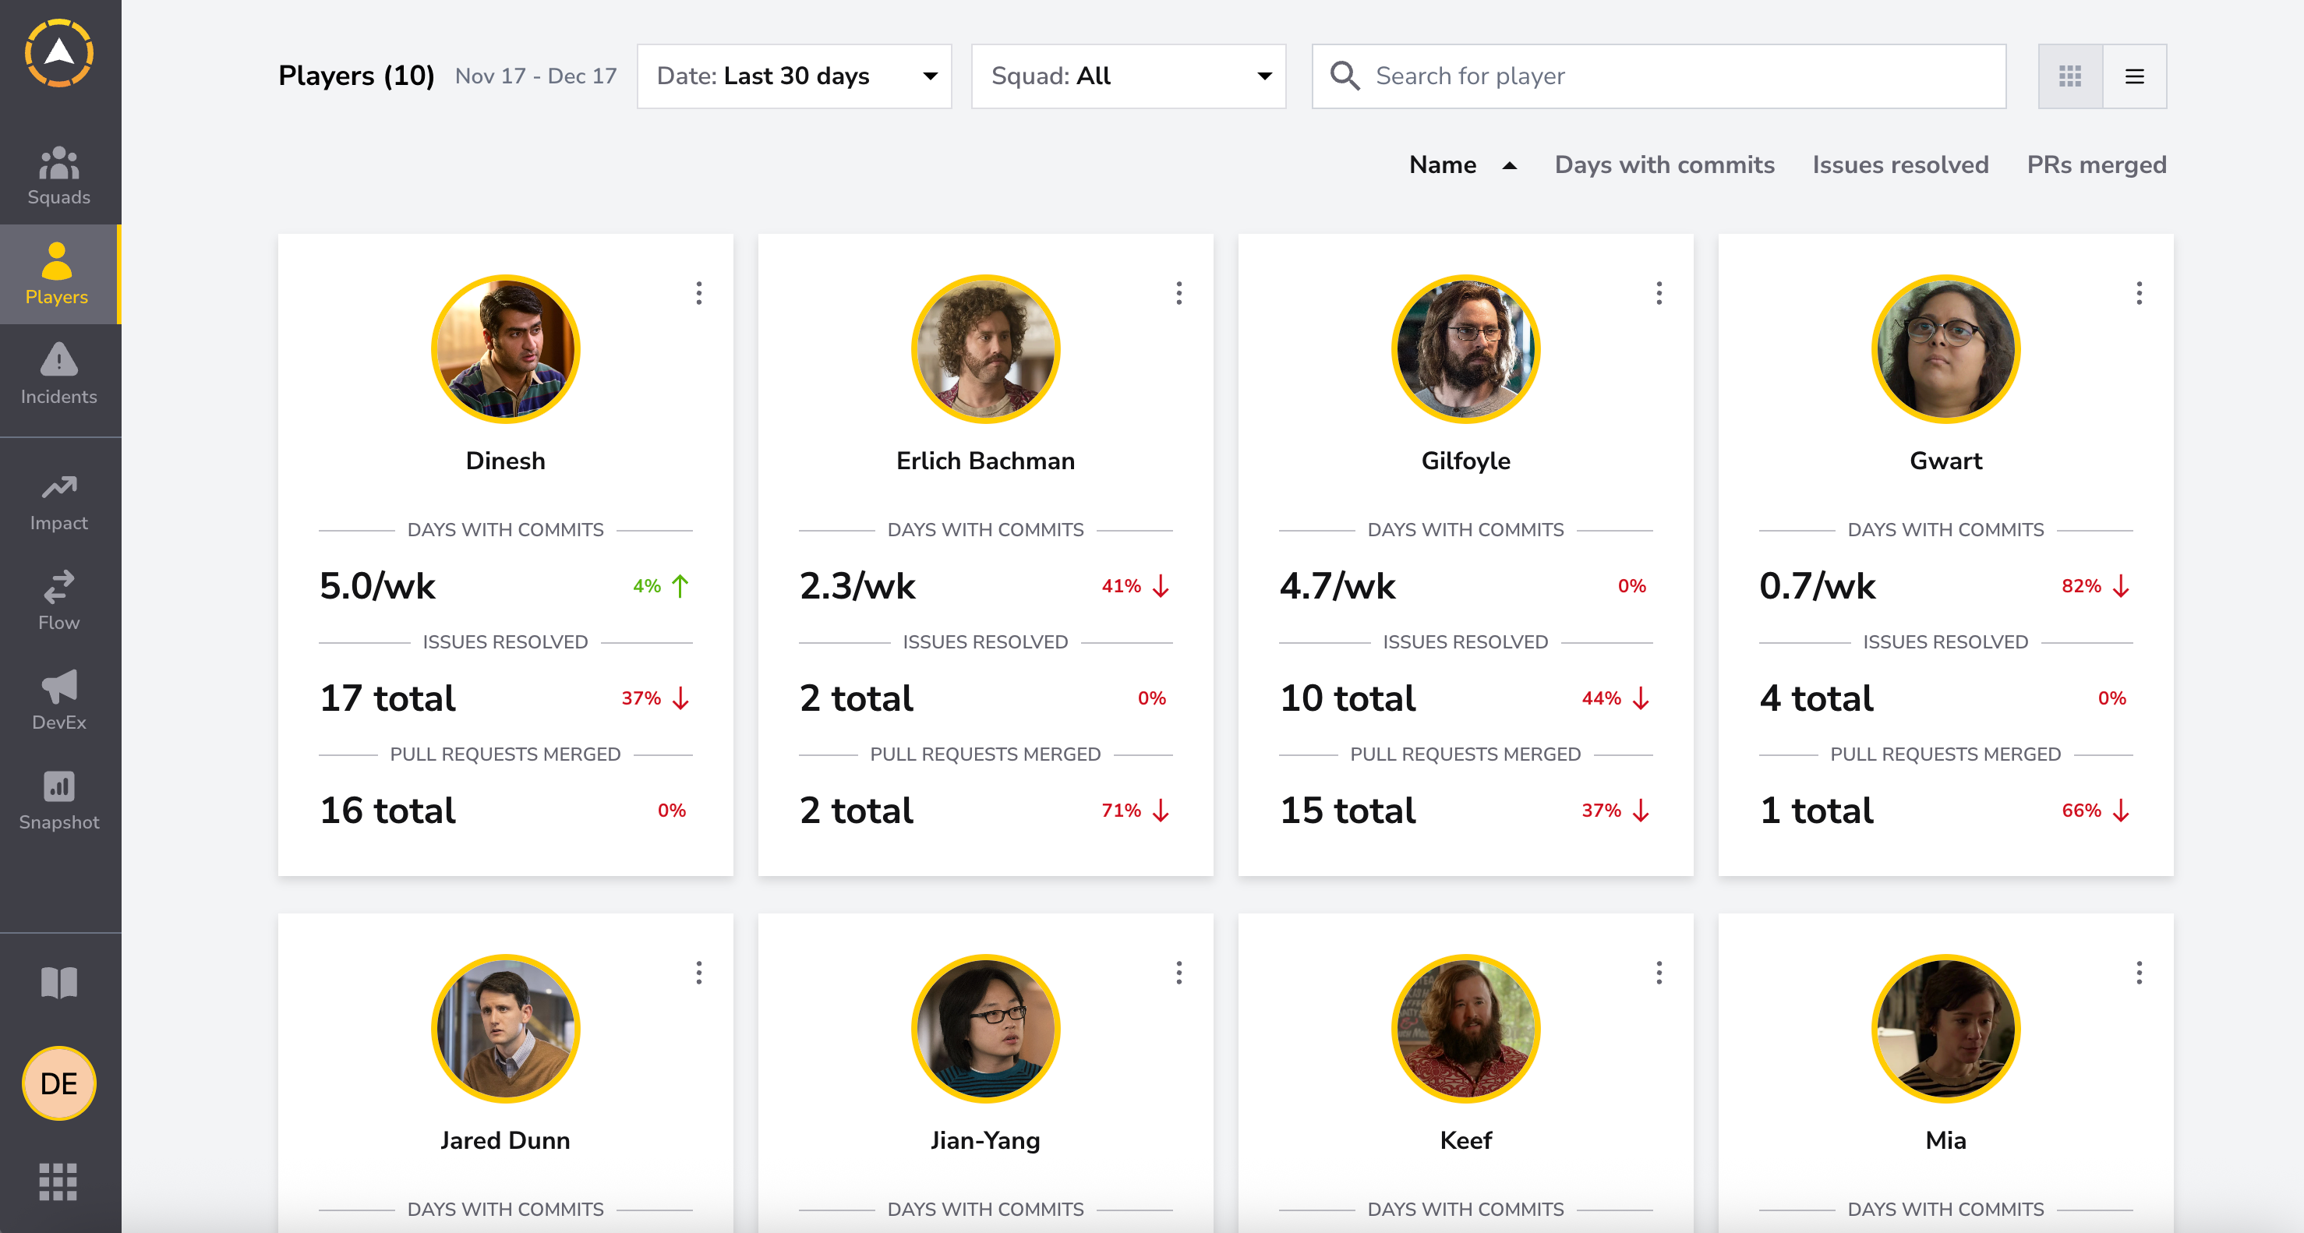
Contributor Snapshot
Every player, one dashboard
See each contributor as a card with their key activity metrics — days with commits, issues resolved, and PRs merged — complete with trend indicators showing week-over-week changes.
- Card and table views for quick scanning
- Trend arrows show improvement or decline
- Sort by any metric to surface patterns
Contributor Snapshot
A
Alex
5.0/wk4%
Days with commits
1737%
Issues resolved
160%
PRs merged
M
Morgan
4.7/wk0%
Days with commits
1044%
Issues resolved
1537%
PRs merged
J
Jamie
2.3/wk41%
Days with commits
20%
Issues resolved
271%
PRs merged
Player Profiles
Deep-dive into individual performance
Click any player to see their full profile — investment breakdown, language usage, contribution volume over time, and activity types like commits, reviews, and comments.
- Investment profile across features, bugs, and enhancements
- Language breakdown by contribution
- Contribution volume charted over days, weeks, or months
Player Profiles
5.0/wkCommits
17Issues
16PRs
8Reviews
Investment Profile
Features 55%Bugs 25%Enhancements 20%
Languages
TypeScript
62%
Python
24%
Go
14%
Filters & Comparison
Slice the data any way you need
Filter by date range, squad, or search for a specific player. Switch between grid and list views, and sort by PR cycle time, PR size, reviews, and more.
- Filter by squad, date range, or player name
- Toggle between grid and detailed table view
- Compare contributors side by side on any metric
Filters & Comparison
NameCommitsIssuesCycle Time ▼
AAlex5.0/wk171.2d
MMorgan4.7/wk101.8d
JJamie2.3/wk23.4d
SSam0.7/wk44.1d
7
Metrics tracked per player
2
Views — card grid & table
1-click
Drill-down to full profile