Visibility & Insights
Your team's velocity, at a glance.
A composite view of your team's delivery speed combining cycle time, throughput, and deployment frequency into one clear metric.
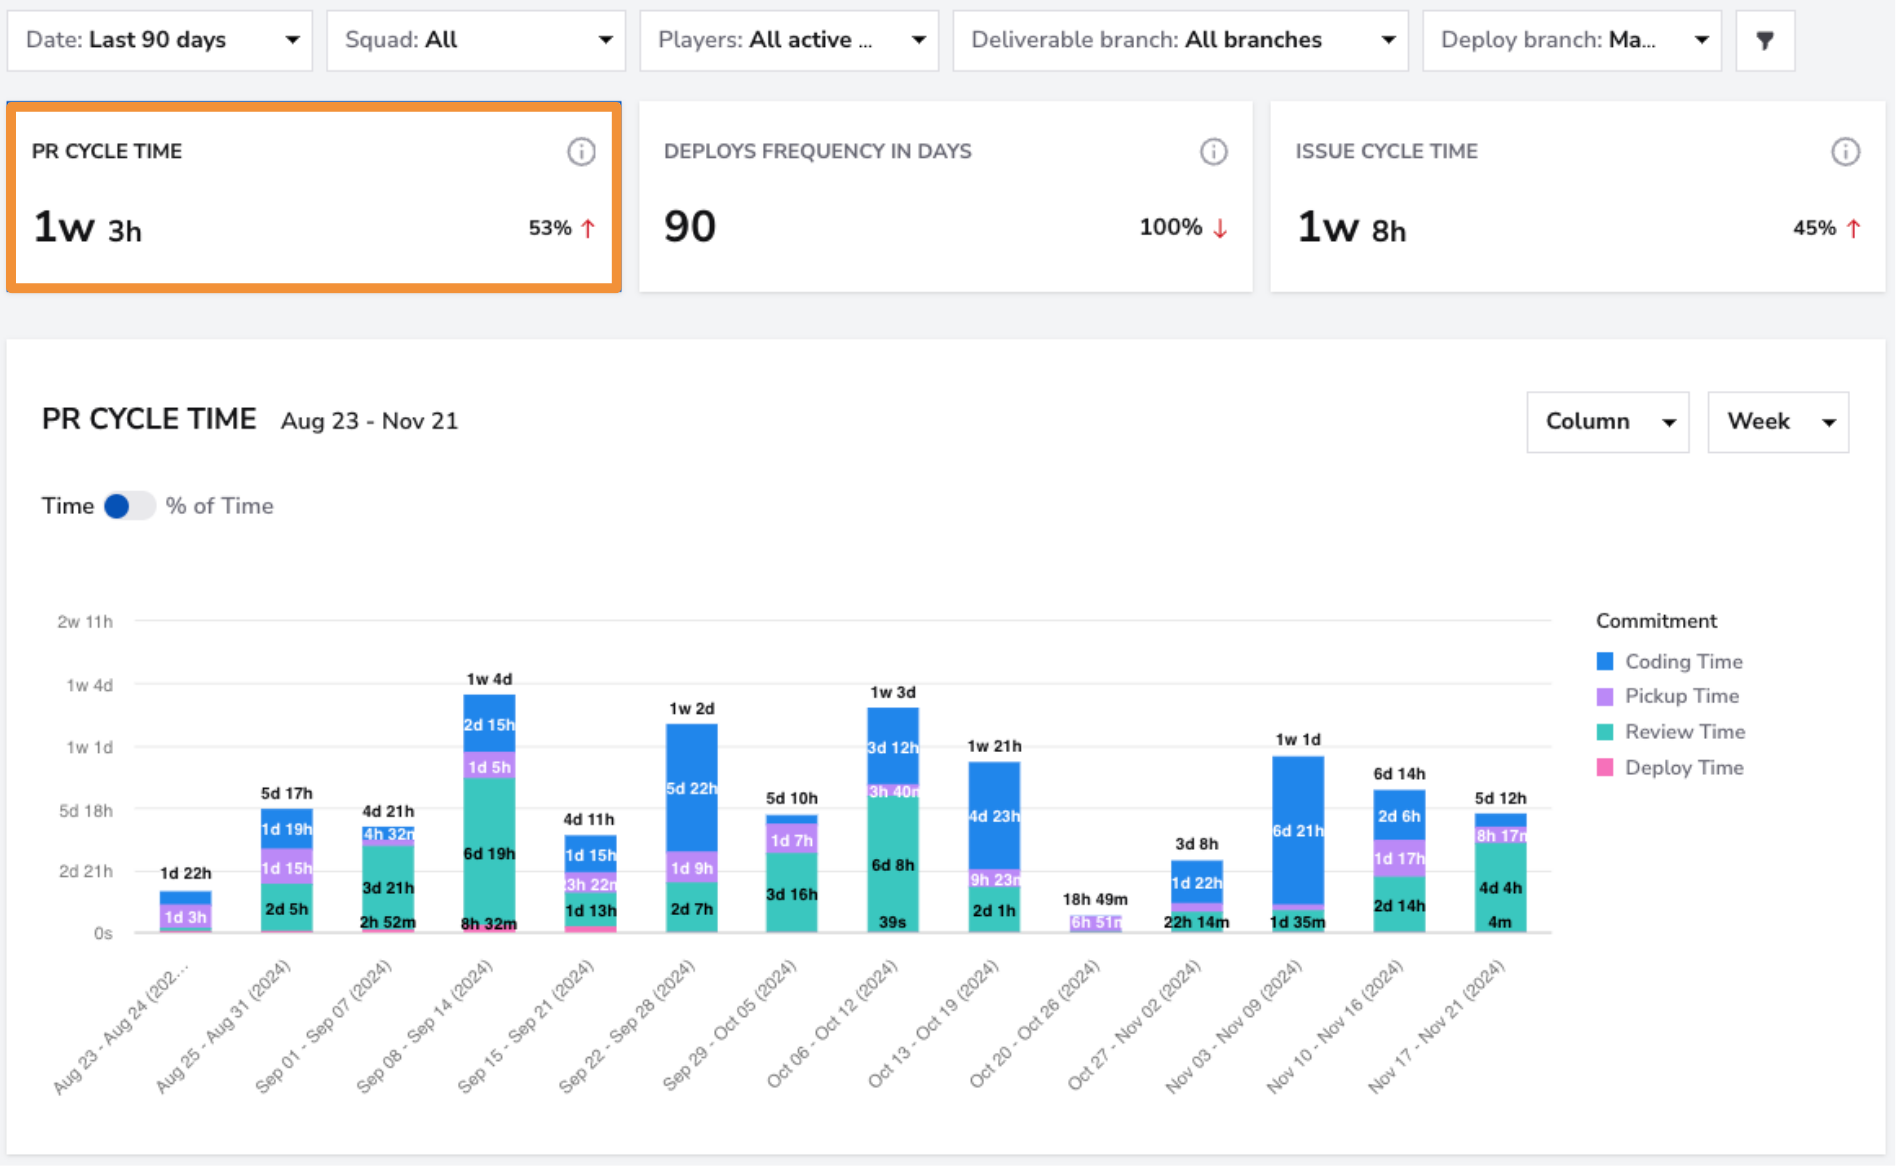
Composite Metric
One number for delivery speed
Speed combines multiple velocity signals into a single, easy-to-track metric for your team.
- Weighted combination of key metrics
- Easy-to-understand speed score
- Week-over-week speed trends
Composite Metric
Benchmarking
Compare against industry standards
See how your speed stacks up against similar teams and industry benchmarks.
- Industry percentile ranking
- Peer team comparison
- Historical speed progression
Benchmarking
Team Alpha1.8d
Team Beta3.2d
Team Gamma2.4d
Team Delta4.1d
Speed Drivers
Understand what drives your speed
Drill into the components that make up your speed score to find targeted improvement areas.
- Component-level breakdown
- Impact analysis per metric
- Improvement recommendations
Speed Drivers
Improved
On track
Needs attention
Top 25%
Industry speed percentile
+18%
Quarter-over-quarter improvement
4.2/5
Team speed score