
Imagine a developer who has started using AI in their day-to-day work. A change is ready faster than usual, yet the pull request needs two extra review rounds. Did the tool improve productivity, or did it move the work downstream?
That trade-off appears across credible research. Controlled experiments show faster task completion and more completed work, while studies in familiar repositories and AI-heavy organizations show slower work, rework, and increased reviewer load. The difference is not simply “good” or “bad” AI use: task boundaries, codebase context, verification difficulty, and delivery-system capacity all shape the result.
The answer depends on what your team builds, who uses the tool, and what happens after the first draft of the code. This article compares the strongest studies, explains why their results differ, and gives you a practical way to test AI's impact without reducing developer productivity to code volume.
The short answer: AI can improve developer productivity, but only in the right conditions
AI can in fact improve developer productivity. The clearest gains appear in bounded work with a verifiable result and enough review capacity to handle the output. Those findings apply to specific tasks and populations, not every developer or codebase.
DORA's 2025 study shows why that distinction matters at the system level. In a survey of nearly 5,000 technology professionals, more than 80% perceived a productivity increase from AI. Yet higher AI adoption was associated with both higher software delivery throughput and higher delivery instability. A team can move more work while making delivery less reliable. Because the study is observational and much of the productivity evidence is self-reported, it identifies a broad pattern rather than proving that AI caused either result.
Coding speed is only one layer. Track completed work, quality, rework, waiting, and developer experience. Then ask three questions: Did comparable work finish faster? Did the gain survive review and delivery? What did the team pay in rework, stability, or attention?
Established approaches to developer productivity metrics and the SPACE framework already treat productivity as multidimensional. Apply that discipline to AI, report conflicting measures, and bound every claim by task, population, measure, and time window.
What the strongest studies show
The cleanest reading is simple. Controlled tasks generally look good. Work inside active repositories is messier.
These studies measured different outcomes with different tools and populations. Their percentages are not interchangeable.
| Study | Context | Result | Limit |
|---|---|---|---|
| GitHub Copilot RCT | 95 participants; randomized Copilot access for one JavaScript task. | Copilot users finished 55.8% faster. | Causal, but limited to one 2022 task. No team or long-term quality data. |
| Three enterprise field experiments | 4,867 developers across three randomized company trials. | AI access increased completed tasks by 26.08%. | Large-scale evidence, but task count does not capture quality or product outcomes. |
| DORA 2025 study | Nearly 5,000 professionals; observational survey plus 100+ hours of qualitative research. | Over 80% reported higher productivity. Adoption correlated with more throughput and instability. | Broad system view, but correlation and self-reports do not prove causality. |
| METR early-2025 RCT | 16 experienced developers; 246 real tasks in familiar repositories. | AI access made work 19% slower. | Causal in real work, but based on a small sample and early-2025 tools. |
| AI-forward enterprise study | 802 developers; 196,212 pull requests in one company. | Pull-request throughput rose; review load roughly doubled. | Shows downstream pressure, but adoption was not randomized and PR volume is not a complete outcome. |
A separate Google enterprise RCT estimated about 21% less time on a complex internal task, with a wide confidence interval. It reinforces the controlled-task pattern without changing the system-level conclusion.
The controlled studies measured task time or completed tasks under randomized access. The repository studies exposed rework and review pressure that a bounded task may never reveal. DORA adds a third level: broad associations between adoption and delivery-system outcomes. Read together, they answer different parts of the question; averaging their percentages would create a return estimate that none of them measured.
Method limits each conclusion. Randomized access strengthens causal claims but captures only the work inside the experiment. Longitudinal studies observe a wider system, while adoption choices make attribution harder. Experiments show whether a gain can happen; field evidence shows what can dilute or redirect it.
The unit matters too. Task time, completed work, and merged pull requests are different outcomes, and none proves that customers received value sooner. Before applying a percentage to a business case, name the outcome and ask whether the study context resembles your work.
Why results change across real-world contexts
Change the work, and you change the result.
A standalone implementation with a clear finish line gives an assistant a narrow problem and gives the developer an easy way to check the answer. Mature repositories are different. They carry undocumented conventions, architectural history, hidden dependencies, and decisions about what must remain untouched. That gap helps explain why bounded experiments found gains while METR observed experienced maintainers taking longer on familiar repositories.
Experience changes where the work lands. The enterprise field experiments found larger gains among less-experienced developers. The Microsoft analysis found a different system effect: peripheral contributors produced more while core contributors absorbed more review and maintenance. An author can move faster while the owner of the codebase gets busier.
Tool generations matter. In METR's follow-up experiment with newer tools, raw estimates suggested 18% faster work among returning participants and 4% faster work among new participants, but both confidence intervals included zero. Selection and time-tracking problems prevented a reliable effect estimate. Treat the update as a reason to retest the question, not proof that the earlier slowdown disappeared.
Verification may be the real constraint. Generating plausible code is cheap; proving that it behaves correctly across security rules, operational assumptions, and code outside the changed files can take much longer. The harder the answer is to verify, the less raw generation speed tells you.
Review capacity sets another limit. Faster authoring loses value when tests, reviewers, and release processes are already saturated. The Microsoft and AI-forward company studies both show why you need to watch where the extra work goes.
DORA's AI Capabilities Model identifies working in small batches, user-centric focus, and quality internal platforms among seven capabilities that interact with AI outcomes. It comes from the same 2025 research program, not an independent experiment, so treat the capabilities as hypotheses rather than a guaranteed recipe.
Finally, access is a weak proxy for use. One developer asks for explanations, another generates tests, and a third delegates a whole change. Lumping those behaviors together can hide the task patterns that actually help or hurt.
Perception will not settle the question either. METR's developers expected AI to help and believed it had helped, even though their measured completion time increased. Their experience still matters, but it answers a different question from elapsed time.
Start with the study closest to your stack. State the mismatch, then test the result against your own delivery data.
Productivity is not just speed: quality, rework, and review load matter
More pull requests can mean more delivery. They can also mean a longer review queue.
In the Microsoft open-source analysis, the post-Copilot period was associated with greater production among peripheral contributors and more rework and maintenance from core contributors. Its finding concerns how work shifted across contributors, not the quality of every AI-assisted change. An apparent authoring gain can become someone else's cleanup work.
The AI-forward company saw a related constraint: pull-request throughput rose substantially while reviewer load roughly doubled. That may still be a worthwhile trade. Throughput alone leaves the question unanswered.
Pair immediate quality signals, such as test success and acceptance, with what happens later: revisions, reopened work, incidents, change failures, maintainability problems, and time spent explaining unfamiliar code. None is sufficient alone. Together they show whether the output held up.
Flow measures complete the view. Track end-to-end PR cycle time, review wait, review rounds, and time to merge. If review becomes the constraint, use code review practices to examine ownership, change size, reviewer distribution, and capacity.
The useful question is whether the extra review buys enough delivery speed to be worth it. Make that trade visible before deciding.
How engineering leaders should measure AI's impact on developer productivity
Set up the measurement before you roll out the tool. Otherwise, you will be trying to reconstruct a baseline after expectations and workflows have already changed.
- Write down the hypothesis. Name the task class, expected benefit, and guardrail. For example: “AI assistance will reduce median completion time for bounded maintenance work without increasing review rounds or post-merge failures.”
- Capture a baseline. Measure the same workflow before rollout and record staffing, repository, task mix, release pressure, and process changes that could affect the result.
- Compare similar work. Separate bounded changes from context-heavy work, planned features from interruptions, and mature repositories from newer code. Report any shift in the mix.
- Pair speed with downstream measures. Track task time and throughput alongside review wait, review rounds, rework rate, stability, and developer experience. A cycle-time view shows whether faster coding survives integration and delivery.
- Record how AI was used. Where feasible, distinguish assisted and non-assisted work and note the tool, mode, and task category. Analyze conditions at the team level and keep usage data out of individual rankings.
- Choose the evaluation window in advance. Review the initial period, then measure again after the team adapts. Early friction may fade, while maintenance costs can take longer to appear.
- Look past the average. Compare the same percentiles and task mix over time. A faster median can hide a growing tail of unusually slow or review-heavy work.
Decide in advance what result would justify expansion, adjustment, or stopping. That keeps the team from moving the goalposts after seeing the data. It also forces the business case to name an acceptable cost: how much extra review, if any, is worth a given improvement in delivery time? A pilot without a decision rule can produce a dashboard and still leave the original question unanswered.
DORA's 2026 ROI framework calls extra review a verification tax and the need for downstream processes to absorb more output pipeline adaptation. Its J-curve is a planning model with unpredictable depth and duration, not evidence that every rollout will recover or deliver a return.
Ask developers about cognitive load, trust, frustration, and work that operational metrics miss. Use those responses alongside observed behavior. In the METR study, perception and elapsed time moved in opposite directions, which is exactly why you need both.
A before-and-after dashboard can reveal a change without proving its cause. Staffing, policy, repository, and product changes remain alternative explanations. Match the strength of your conclusion to the strength of the comparison.
DevStats provides a neutral view of AI usage that you can read alongside delivery and quality measures. Those views help structure the evaluation; the comparison design determines what you can claim.
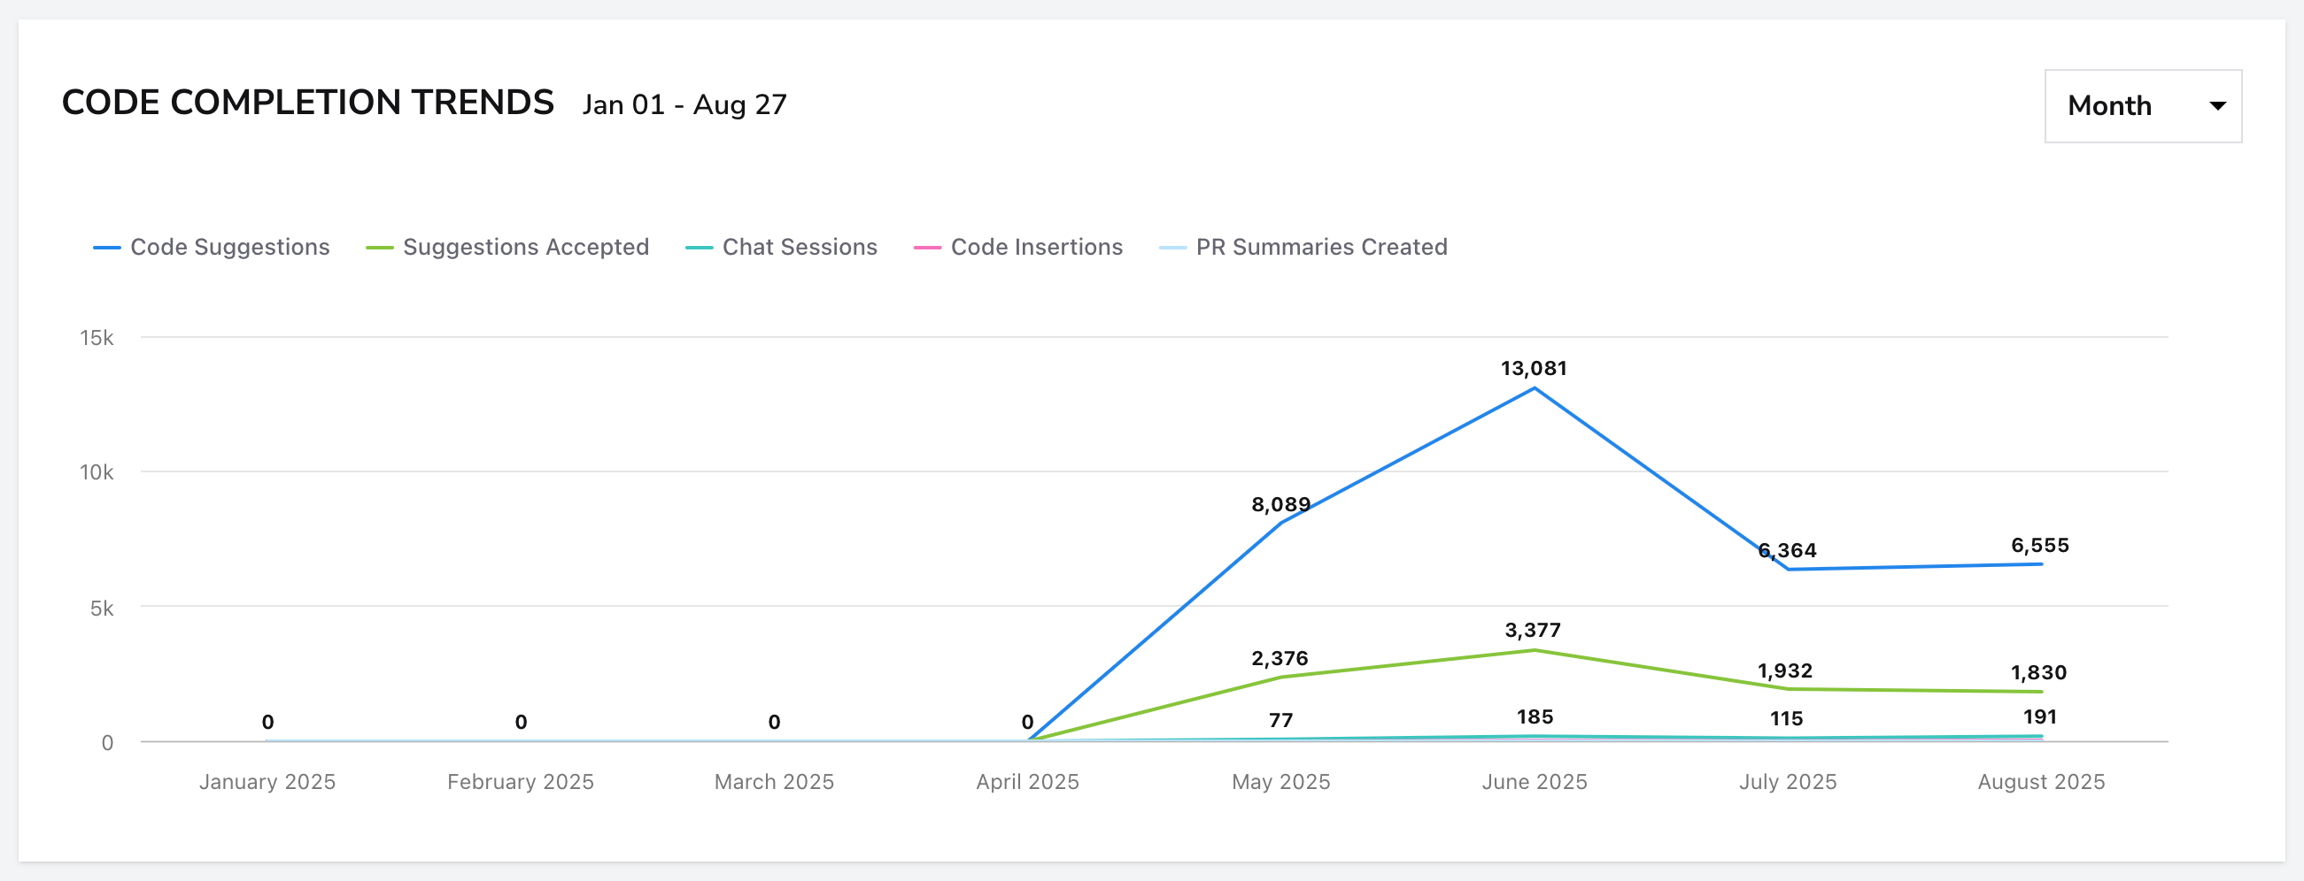
Example DevStats AI Usage report. These activity signals show adoption, not productivity; read them alongside cycle time, review load, rework, and stability.
So, should your team invest in AI coding tools?
Yes, if you can evaluate the rollout as a system change instead of assuming a productivity gain.
Start with bounded, verifiable tasks where the evidence is strongest and the baseline is visible. Be more cautious with context-heavy work in mature repositories or teams whose reviewers are already overloaded.
Then ask one question: did the whole delivery system improve? Faster comparable work is a gain. Faster authoring followed by disproportionate review, rework, or instability is a bottleneck shift. If results differ by task, you have learned where the tool belongs.
The pilot only needs a trade-off the team understands and considers worthwhile. An inconclusive result is useful too: narrow the use case, change the workflow, or wait before expanding the rollout.
AI can improve developer productivity. Your own delivery system decides whether that potential survives contact with real work. If coding gets faster while review and rework rise, AI did not remove the bottleneck. It moved it.