Flow
Measure what your team actually ships.
Track merged pull requests and completed issues over time. Understand your team's true delivery velocity without counting busywork.
Delivery Tracking
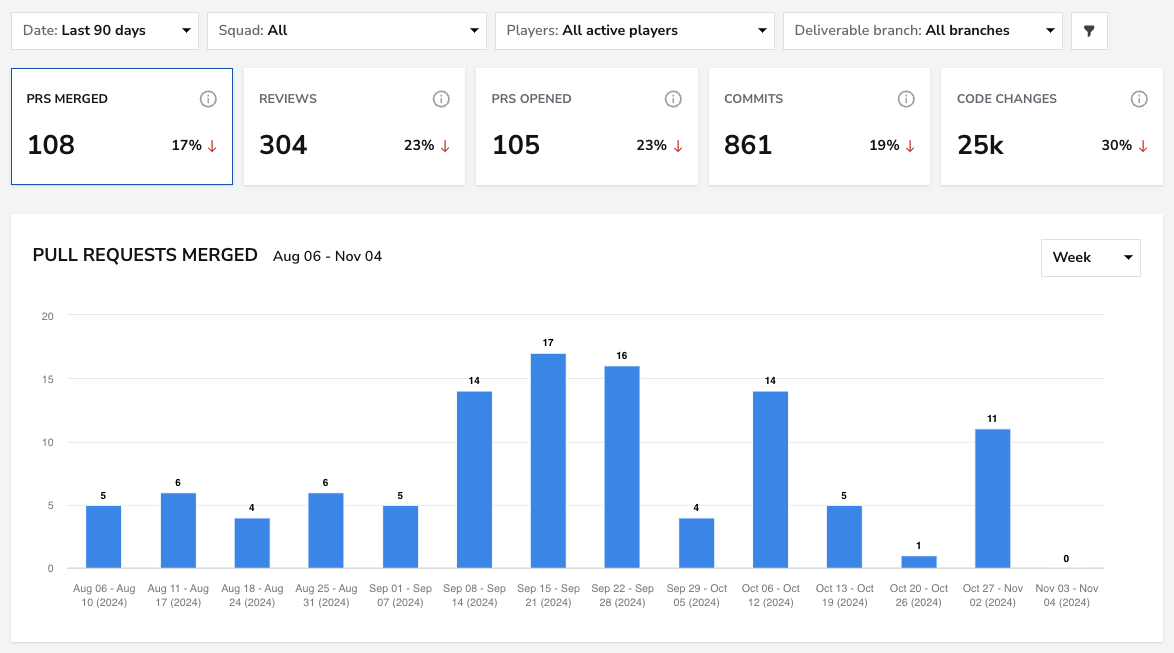
Count what matters — shipped work
See how many PRs are merged and issues completed each week. Filter by team, repo, and time range.
- Weekly and monthly throughput charts
- PR and issue throughput independently
- Filter by label, repo, and team
Delivery Tracking
Trend Analysis
Spot trends before they become problems
Visualize throughput trends to catch slowdowns early and correlate with team changes or process updates.
- Moving average trend lines
- Detect throughput dips early
- Correlate with sprint events
Trend Analysis
Team Alpha1.8d
Team Beta3.2d
Team Gamma2.4d
Team Delta4.1d
Technical Debt
Detect hidden technical debt
When throughput drops while effort stays constant, it often signals growing technical debt. Catch it early.
- Throughput vs. effort correlation
- Technical debt early warning signals
- Compare new feature vs. maintenance throughput
Technical Debt
Improved
On track
Needs attention
24%
Increase in weekly throughput
150+
PRs merged per team per month
3x
Better sprint predictability