Planning & Sprints
Run better sprints with real data.
Track sprint health, velocity, and completion rates. Understand what your team can actually deliver and plan accordingly.
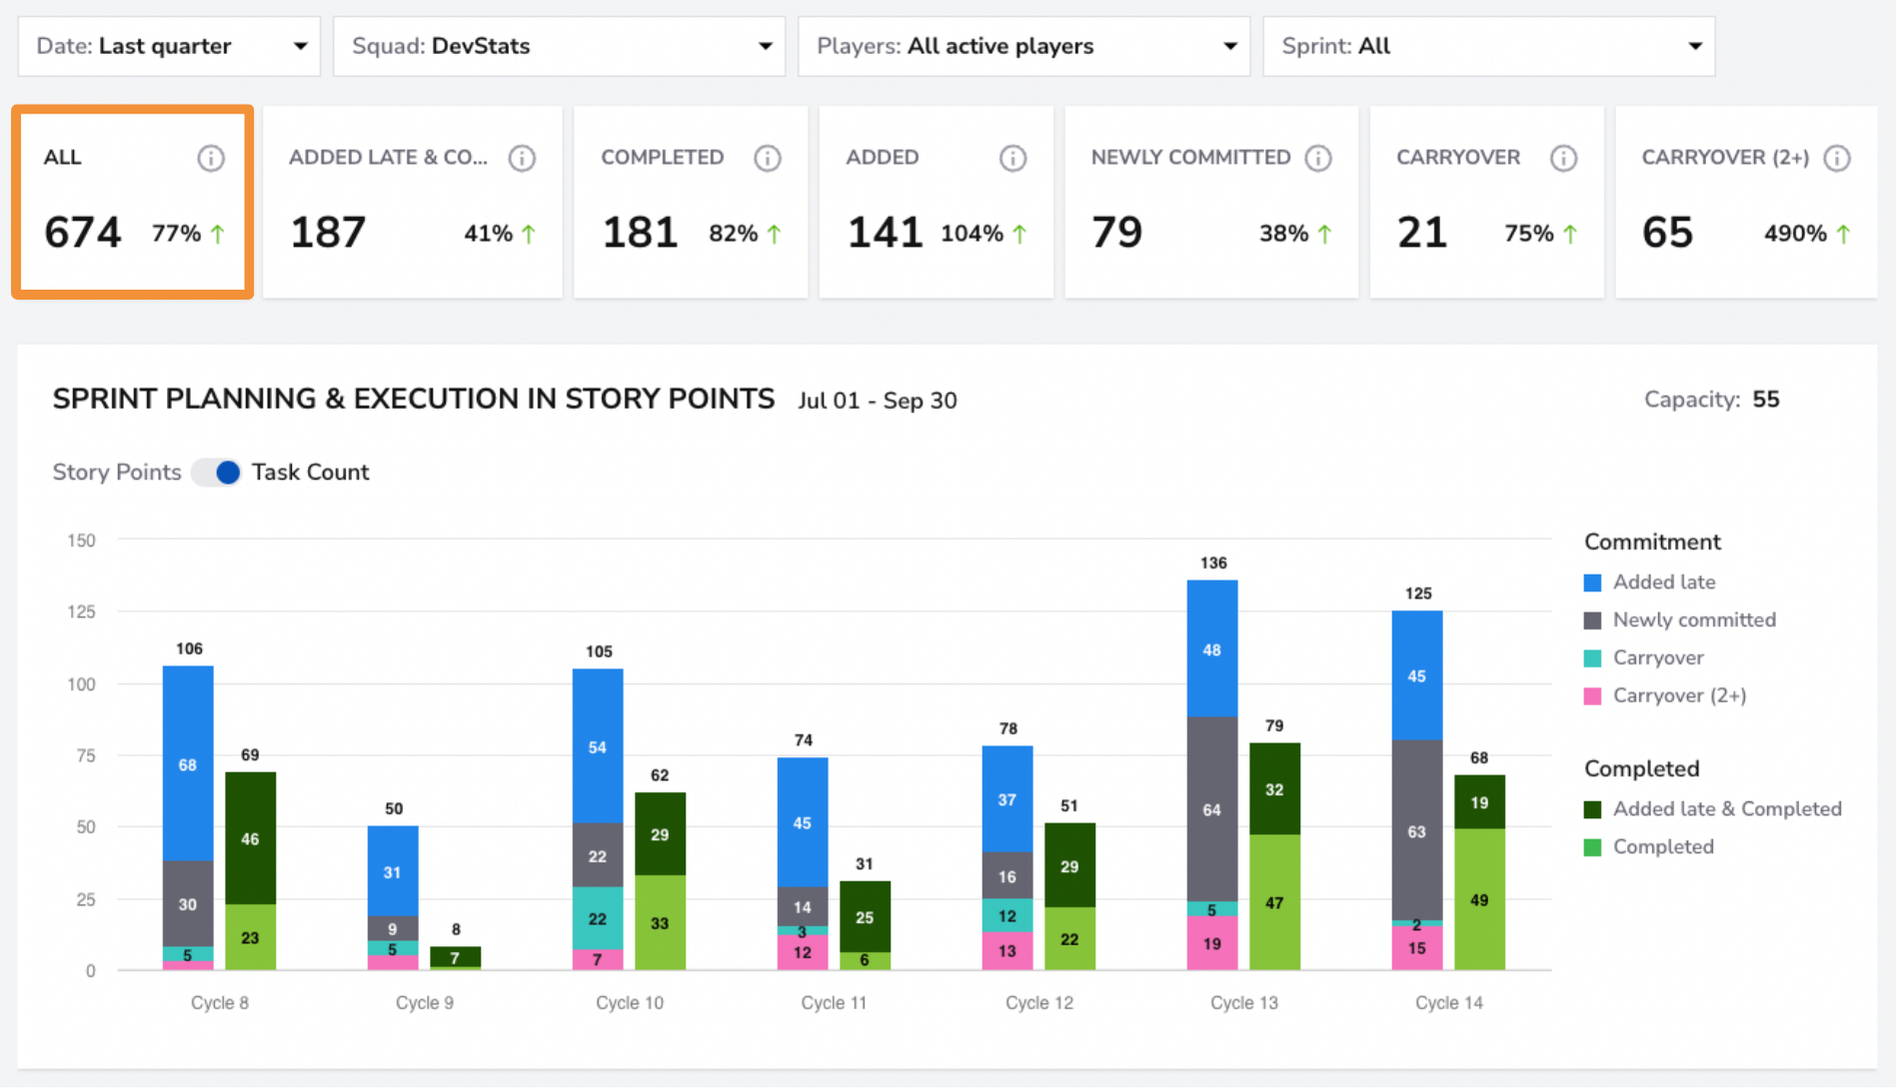
Sprint Dashboard
Full visibility into every sprint
See planned vs. completed work, scope changes, and velocity trends across all your sprints.
- Real-time sprint burndown charts
- Scope change tracking mid-sprint
- Story point accuracy analysis
Sprint Dashboard
Velocity Tracking
Build a reliable velocity baseline
Track velocity over time to build a stable baseline for planning future sprints with confidence.
- Rolling velocity averages
- Sprint-over-sprint comparison
- Team capacity modeling
Velocity Tracking
Team Alpha1.8d
Team Beta3.2d
Team Gamma2.4d
Team Delta4.1d
Health Indicators
Detect unhealthy sprint patterns
Catch warning signs early — like excessive carryover, late scope additions, or unbalanced workloads.
- Carryover rate tracking
- Late addition detection
- Workload distribution analysis
Health Indicators
Improved
On track
Needs attention
85%
Average sprint completion rate
±10%
Velocity variance (down from ±35%)
0
Surprise scope additions per sprint