Flow
Ship issues faster, every sprint.
Track how long issues take from creation to completion. Identify patterns in your workflow that slow down delivery.
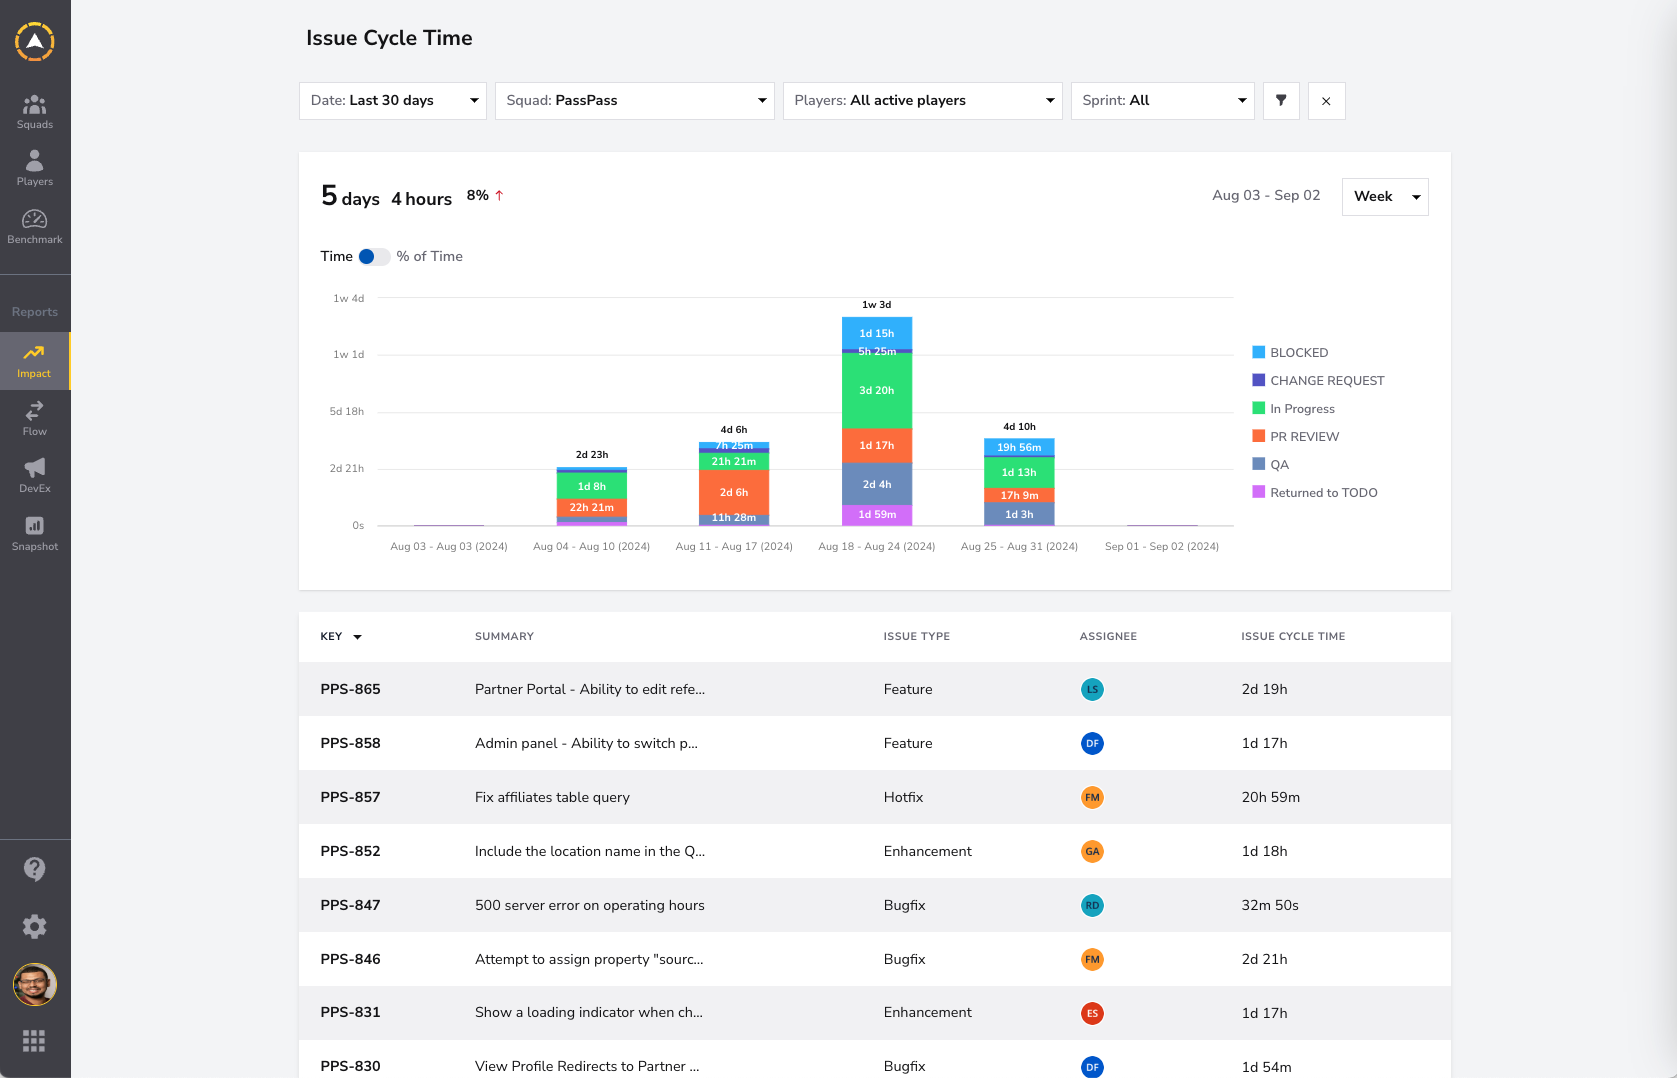
End-to-End Tracking
Measure every issue from start to finish
See the full lifecycle of every issue — from backlog to done. Understand where time is actually spent.
- Track time across all workflow states
- Filter by issue type, priority, and label
- Spot stalled issues before they become problems
End-to-End Tracking
Workflow Analysis
Understand your workflow patterns
Identify which workflow transitions take the longest and where issues tend to get stuck.
- State transition heatmaps
- Average time per workflow state
- Outlier detection for stuck issues
Workflow Analysis
Team Alpha1.8d
Team Beta3.2d
Team Gamma2.4d
Team Delta4.1d
Continuous Improvement
Drive down cycle time sprint over sprint
Set targets, track trends, and celebrate improvements with your team.
- Sprint-over-sprint comparisons
- Configurable cycle time targets
- Team-level and individual breakdowns
Continuous Improvement
Improved
On track
Needs attention
40%
Reduction in issue cycle time
2.5x
Faster hotfix resolution
90%
Issues completed within target