Quality & Reliability
Track the four keys to software delivery.
Measure Deployment Frequency, Lead Time for Changes, Change Failure Rate, and Mean Time to Recovery — the gold standard for DevOps performance.
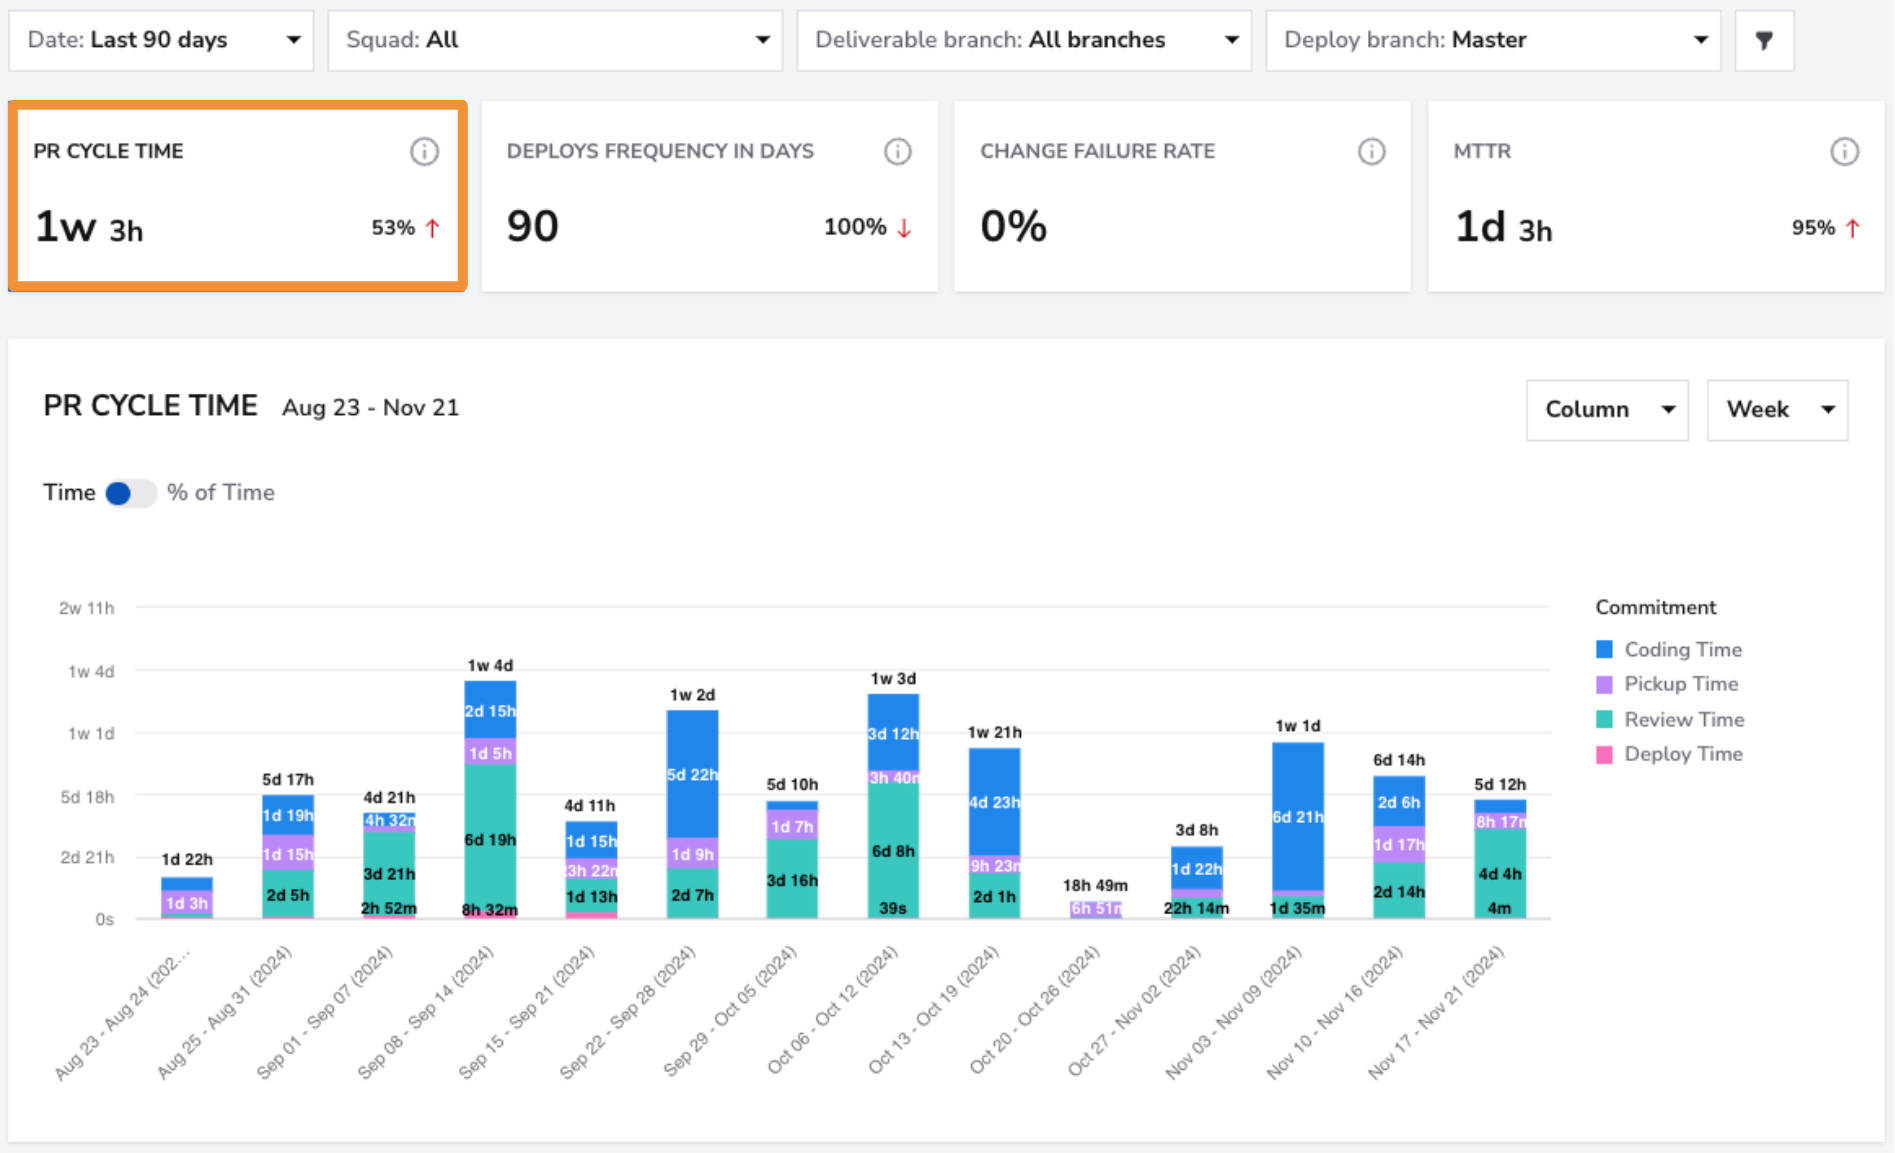
Four Key Metrics
All four DORA metrics in one dashboard
See your Deployment Frequency, Lead Time, Change Failure Rate, and MTTR side by side.
- Real-time DORA dashboard
- Automatic data collection from your tools
- No manual tagging required
Four Key Metrics
Performance Level
Know your DORA performance level
DevStats automatically classifies your team as Elite, High, Medium, or Low performer based on the DORA research benchmarks.
- Automatic performance classification
- Benchmark against DORA research data
- Track progression over time
Performance Level
Team Alpha1.8d
Team Beta3.2d
Team Gamma2.4d
Team Delta4.1d
Improvement
Level up your DORA performance
Get actionable insights on which metric to focus on to move to the next performance level.
- Targeted improvement recommendations
- Metric-level drill-downs
- Team and org-level DORA views
Improvement
Improved
On track
Needs attention
Elite
Target DORA performance level
< 1 day
Lead time for changes
< 5%
Change failure rate