
If you're not tracking the right metrics, your development team is flying blind. You think your team is delivering value and crushing it on speed and quality, but without the data to back it up, you're just guessing. And in this game, guessing doesn't cut it.
Metrics are your secret weapon. They give you the power to ship faster, improve code quality, and avoid late-night firefighting caused by technical debt. With the right metrics, you can spot bottlenecks, optimize workflows, and keep your team aligned with real business goals.
Many teams focus on vanity metrics that look good on dashboards but offer little insight into performance or impact. This leads to misaligned priorities, inefficiencies, and cycles of slow releases and escalating tech debt.
We've got 21 must-track metrics that will change how you run your team—metrics that cover everything from code quality to engineering velocity, productivity, and technical debt management.
Code quality metrics
When it comes to building solid software, code quality is king. Poor code leads to fragile systems, endless firefighting, and long nights fixing avoidable bugs. These metrics give you a direct line of sight into your code's health and help you catch problems before they explode.
1. Change Failure Rate
High change failure rates are a red flag for unstable deployments, poor testing, and rushed merges. Every failed deployment means downtime, firefighting, and frustrated users. Track change failure trends over time. If failures rise, it's time to level up your testing, enforce stricter code reviews, and refine your CI/CD pipeline to catch issues earlier.
2. PRs Merged without Review
Merging pull requests without review is a fast track to disaster. Bugs slip through, tech debt piles up, and code quality nosedives. Skipping reviews may seem efficient, but it'll cost you in the long run with fragile systems and costly rework. Watch this metric like a hawk. Enforce a strict "no unreviewed PRs" policy and set automated checks to catch violations.
3. Issues Caught in Reviews
The review process is your first line of defense against sloppy code. Catching issues early saves time, reduces bugs in production, and keeps your team from firefighting later. More issues caught in reviews mean fewer headaches post-deploy.
4. Rework and Refactor Trends
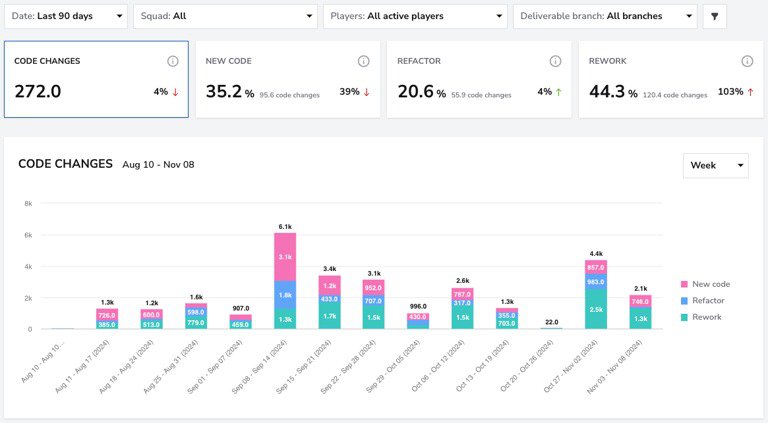
Rework and refactoring are part of the game, but too much means you're fixing more than building. Constant rework drains velocity, eats into sprint capacity, and signals deeper issues like unclear requirements or sloppy code practices. Balance is key.
Engineering velocity metrics
Speed matters. If your team isn't delivering quickly, your competition will. Engineering velocity metrics show how efficiently work moves from idea to production.
5. PR Cycle Time
Long PR cycle times kill momentum and slow delivery. The faster your team moves PRs through coding, review, and deployment, the faster you deliver value. Break down cycle time into phases: coding, pickup, review, and deployment. Track where delays happen and tackle them head-on.
6. Deploy Frequency
The more often you deploy, the faster you get feedback, reduce risks, and deliver value. High deploy frequency keeps your team agile, allowing for quick iteration and faster fixes. If you're deploying once a month, you're already losing.
7. Daily WIP (Work in Progress)
Too many tasks in progress? Your team's juggling too much, and progress grinds to a halt. High WIP means more context-switching, slower delivery, and unfinished work piling up. Keep it lean and focused to maintain flow and velocity.
8. Issue Cycle Time per Task Type
Issue cycle time shows how fast your team resolves tasks. Long cycle times slow delivery, frustrate users, and hint at deeper workflow problems. Breaking it down by task type—features, bugs, hotfixes—gives you clarity on where things get stuck.
Technical debt metrics
Technical debt is the silent killer of engineering teams. It slows development, increases failure rates, and turns simple changes into all-night coding marathons.
9. Rework Percentage
Rework is a productivity killer. High rework means your team spends more time fixing old mistakes than building new features. It's a clear sign of poor planning or rushed work.
10. Refactoring Trends
Refactoring is essential for keeping your codebase clean and maintainable. But if refactoring dominates your sprint, you're not moving forward—you're stuck in code cleanup mode. Balancing refactoring with new features is key to maintaining velocity.
11. Technical Debt Ratio
When more time goes into refactoring than building new features, your team's buried in debt. This ratio shows how much tech debt is holding you back. A high ratio means you're cleaning up more than you're innovating.
Productivity and collaboration metrics
Productivity isn't about churning out code—it's about maintaining a steady, sustainable flow of high-quality work. Collaboration is the fuel that keeps that flow moving.
12. PRs Opened vs. PRs Merged
A growing gap between PRs opened and merged means bottlenecks. Work piles up, reviews get delayed, and your pipeline grinds to a halt. Monitor this ratio weekly.
13. Comments per Review
Comments are where the real collaboration happens. A high number of comments means engaged reviewers, deeper code discussions, and fewer bugs slipping through. When comments drop, it's a red flag for rushed or superficial reviews.
14. Days with Commits
Consistent commits show steady progress and a healthy development rhythm. Gaps in activity could mean blockers, disengagement, or uneven workloads. More commit days = smoother releases and fewer fire drills.
15. Unreviewed PRs
An unreviewed PR is a ticking time bomb. Code merges without review can introduce bugs, increase technical debt, and compromise stability. It might feel faster, but you'll pay for it later in fixes and downtime.
Deployment and reliability metrics
Fast, reliable deployments are the backbone of high-performing teams. Frequent releases mean faster feedback, quicker iterations, and fewer risky, big-bang deployments.
16. Deployment Frequency
Frequent deployments mean shorter feedback loops and less risk. Teams that deploy regularly can adapt quickly, ship features faster, and stay ahead of the competition.
17. Change Failure Rate (DORA Metric)
This is your go-to metric for stability. A high change failure rate signals weak testing, rushed deployments, or tech debt lurking in the shadows. Every failed deployment means downtime, lost productivity, and unhappy users.
18. Mean Time to Recovery (MTTR)
Outages happen, but how fast you recover is what really counts. MTTR measures how quickly your team restores service after a failure. The shorter your MTTR, the less impact on users and the faster you get back to shipping features.
19. Code Coverage Percentage
Code coverage tells you how much of your code is tested. Low coverage means hidden bugs and higher failure risks. It's not about hitting 100%—it's about making sure critical paths are covered to reduce nasty surprises in production.
20. Business Alignment Metrics
If your team spends more time firefighting than building new features, you've got a problem. Business alignment metrics track how much work goes toward strategic goals versus unplanned distractions.
21. Sprint Predictability
Predictable sprints mean your team delivers what they commit to—on time and without surprises. When predictability drops, deadlines slip, priorities shift, and trust erodes fast.
Best practices for using these metrics effectively
Use an engineering metrics dashboard
Centralize your metrics with a powerful dashboard to get real-time insights into performance. A dashboard eliminates manual tracking, reduces errors, and provides clear visualizations that help your team make data-driven decisions fast.
Avoid common pitfalls
- Misinterpreting Metrics: Focus on trends and patterns, not isolated data points.
- Vanity Metrics: Ignore numbers that look impressive but don't drive value (e.g., total commits without context).
- Micromanagement: Use metrics to empower your team, not to control every move.
Align metrics with business goals
Metrics should support your business objectives. Tie code quality, velocity, and collaboration metrics to broader goals like faster feature delivery, improved user experience, or revenue growth.
Follow a continuous improvement cycle
Treat metrics as part of a feedback loop.
- Identify problem areas.
- Plan realistic, data-backed improvements.
- Execute necessary changes.
- Review progress regularly. Iterate and repeat.
Tracking the right metrics isn't just about numbers—it's about building a smarter, faster, and more reliable engineering team that consistently delivers real impact.