
LinearB is a strong platform for teams that want workflow automation and engineering metrics in one place. But its credit-based billing, configuration overhead, and automation-first design are not the right fit for every engineering org.
If you are paying for gitStream rules and WorkerB bots your team does not use, or if the credit system makes your monthly costs hard to predict, there are alternatives that deliver comparable metric depth at lower cost and complexity.
This guide covers ten of them, with honest tradeoffs on pricing, depth, and fit by team size.
Key takeaways
-
LinearB bundles engineering metrics with workflow automation and charges for both through a credit-based billing model. Teams that want metrics without automation overhead are paying for a product designed around a different use case, and the credit system makes costs difficult to predict as usage grows.
-
The strongest LinearB alternatives differ by what they prioritize. Some focus on developer experience surveys, some on delivery flow metrics, and some, like DevStats, give engineering leaders a diagnostic instrument they can use without a dedicated analyst or a months-long implementation.
-
Team size matters more than feature count when choosing a platform. Tools built for 500-engineer organizations add complexity that slows down a team of 30.
-
DevStats gives VPs of Engineering and engineering managers DORA metrics, a 5-stage PR cycle time breakdown, AI coding tool ROI tracking, and engineering investment visibility, starting at $15/month per contributor with a 2-minute setup. Contact us to see it against your team's actual stack.
Why look for a LinearB alternative?
LinearB pairs engineering metrics with workflow automation and charges for both. For teams that actively use that automation, the value is clear.
However, for teams that mainly need delivery visibility and DORA benchmarking, here's why it's not the best tool:
-
The credit-based billing model makes costs hard to predict. Every automated PR action consumes credits, and overages bill at $0.015 per credit on top of per-seat fees ($29 to $59/dev/month billed annually).
-
LinearB's Essentials plan only supports GitHub Cloud. Teams on GitLab, Bitbucket, or Azure DevOps need the Enterprise tier at $59/dev/month to connect.
-
Configuring gitStream rules, WorkerB bots, and programmable workflows takes time that teams without a dedicated platform engineer often cannot justify when they only need metrics.
-
Cycle time reporting stays at the aggregate level. LinearB does not break PRs into the five discrete stages (coding, pickup, review, merge, deploy) that let engineering managers pinpoint where work stalls.
-
AI coding tool tracking is partial, covering fewer tools than platforms that treat AI ROI measurement as a primary feature.
Alternative #1: DevStats
Best for: Growth-stage SaaS companies with 15+ developers that need delivery intelligence at mid-market pricing, without workflow automation overhead or credit-based billing.
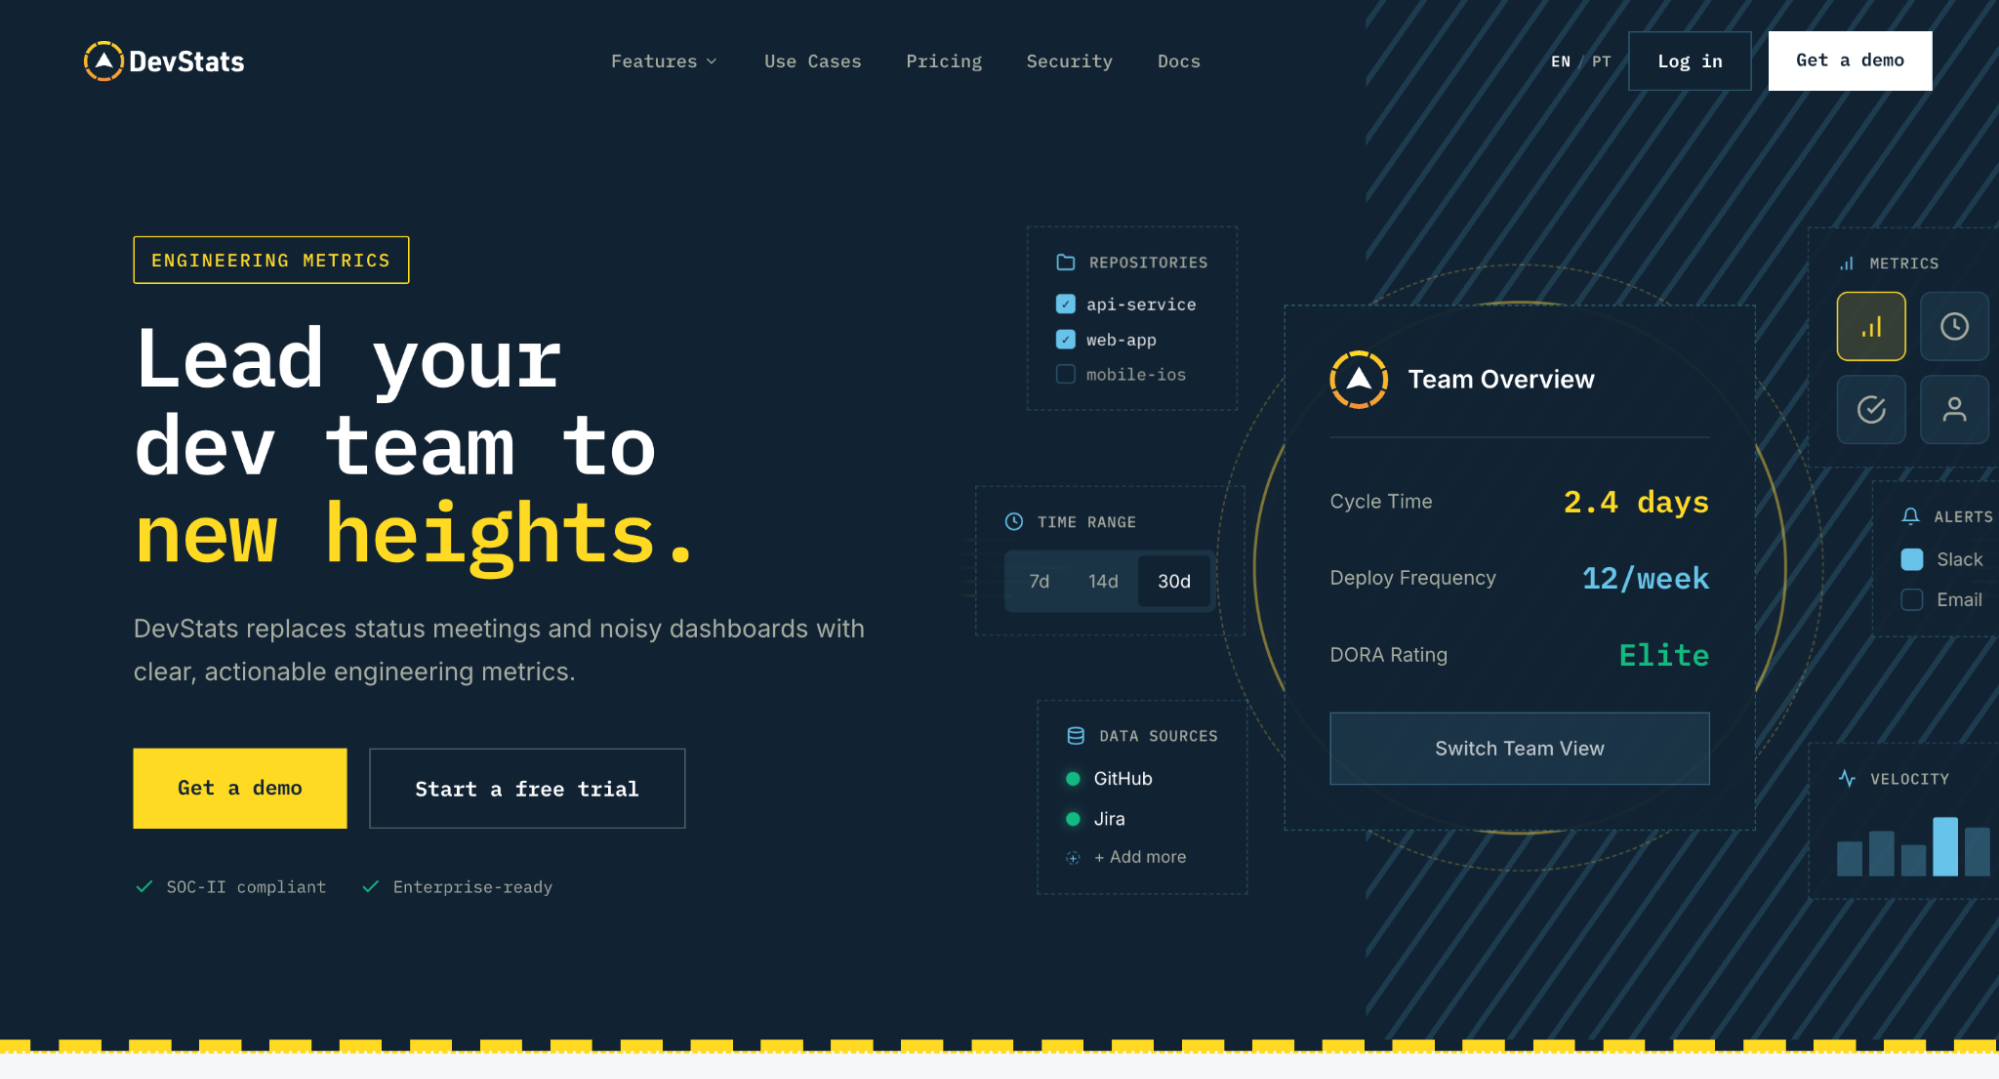
DevStats was built internally at DevSquad, a software development agency, and later spun out as a standalone product. The team had been using competitor tools to measure developer performance. When those products declined, building their own was the obvious next step.
The result is a platform that covers the same metric categories as LinearB (DORA, cycle time, engineering allocation, AI tool impact) without the workflow automation layer that drives LinearB's pricing model.
You get the diagnostic data. You skip the credits, the gitStream configuration, and the WorkerB bots. Setup takes under 2 minutes, pulls three years of historical data, and requires no sales call. It is SOC 2 Type II certified and starts at $15/month per contributor.
Features
- DORA Metrics with benchmarking against 1,000+ engineering teams
- 5-stage PR Cycle Time breakdown (Coding, Pickup, Review, Merge, Deploy)
- Engineering Investment and Allocation dashboards
- AI Impact Reports across GitHub Copilot, Cursor, Claude Code, Amazon Q, Cody, and Windsurf
- Code Review metrics including reviewer load balancing and PR size flags
- Developer 360 views with activity heatmaps for burnout detection
- Sprint tracking, scope creep detection, and planning accuracy reports
- 20+ integrations across Git, issue tracking, incident management, and AI tools
- SOC 2 Type II compliance
Benefits
Deeper cycle time diagnosis than aggregate views provide
LinearB shows cycle time as a single number or a high-level breakdown. That tells you delivery is slow. It does not tell you whether the problem is in coding, pickup, review, merge, or deploy.
DevStats's PR Cycle Time report breaks down every pull request into five stages. If PRs consistently stall between opening and being picked up for review, that pattern is visible immediately rather than hidden in an aggregate average.
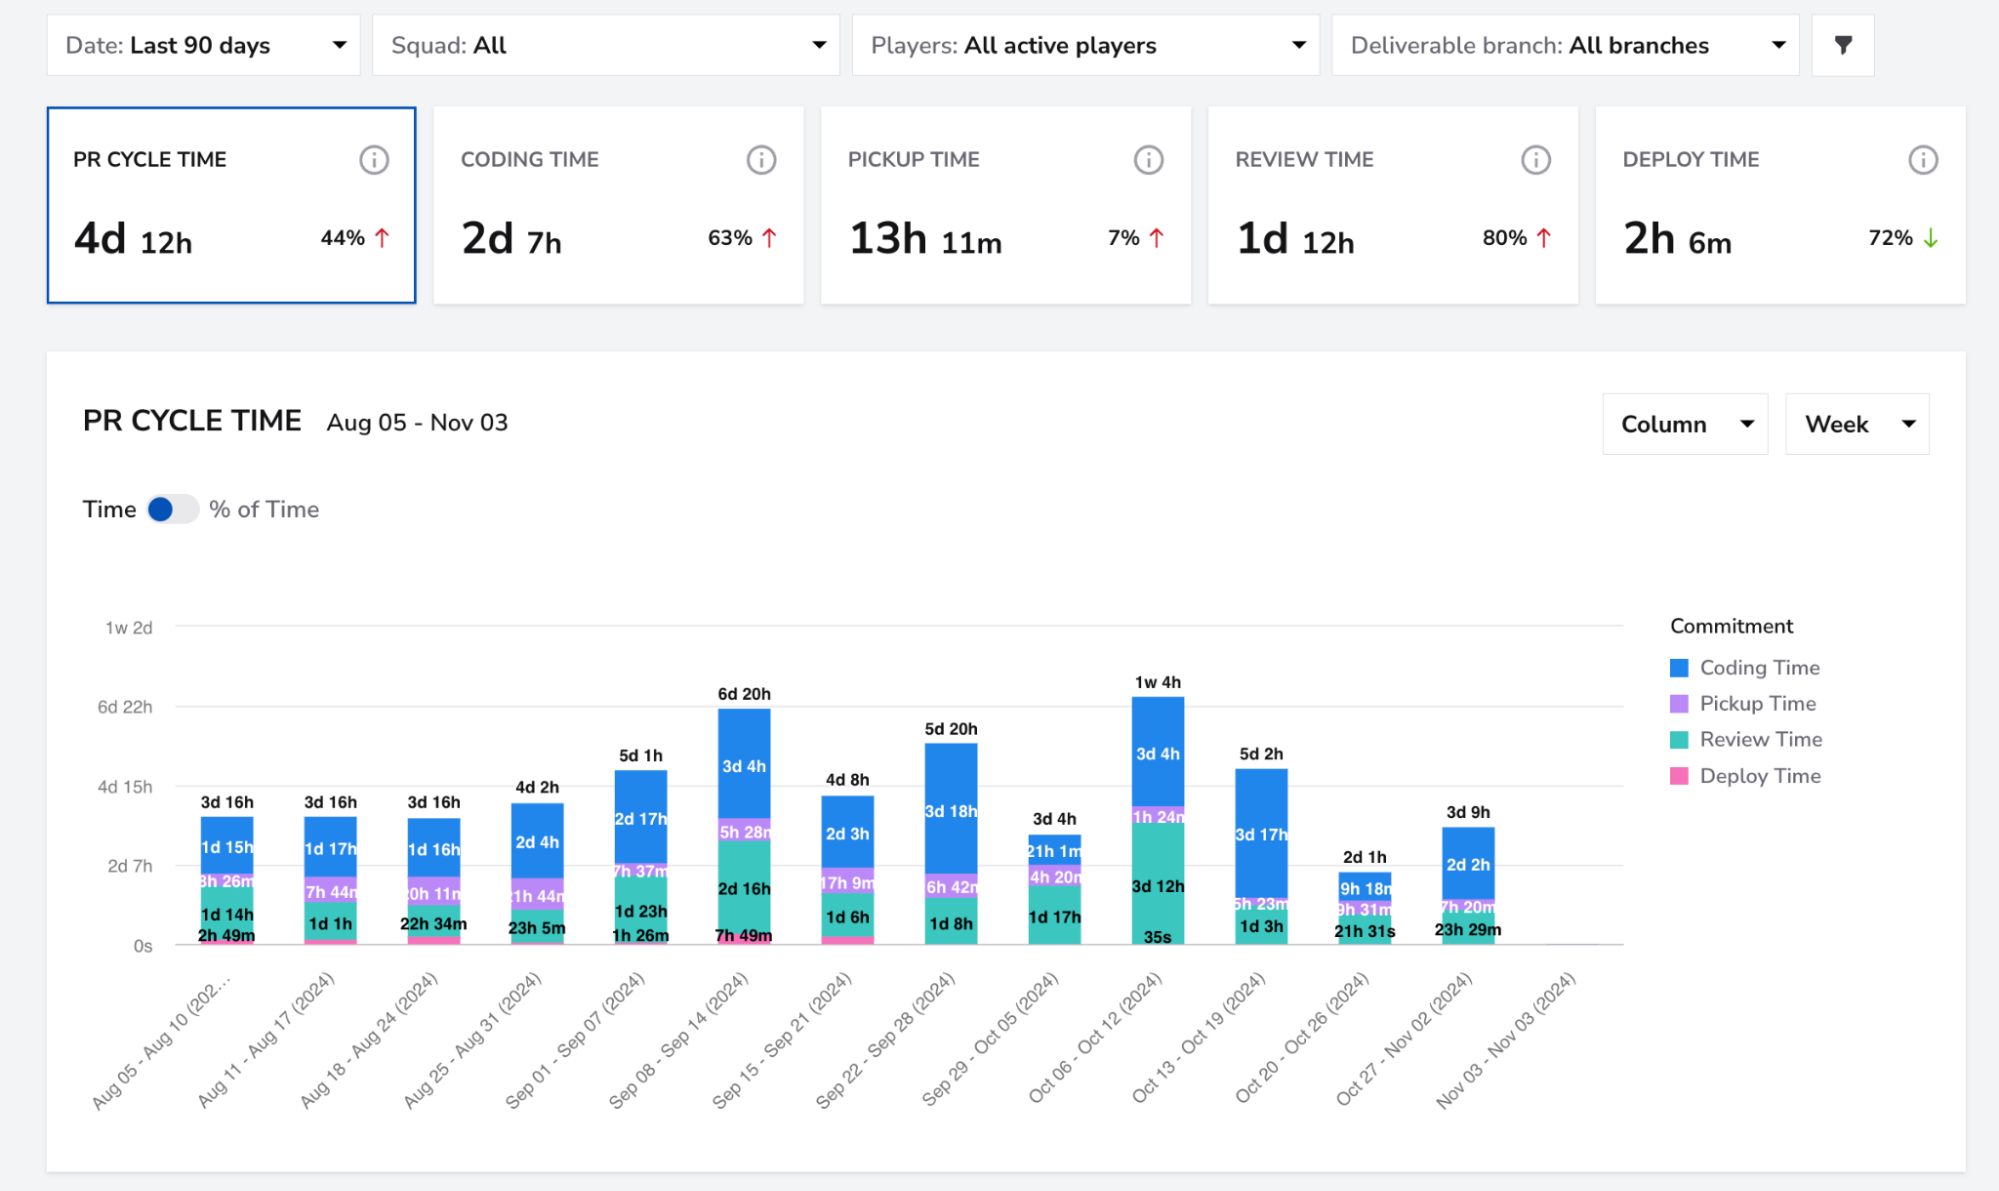
That granularity changes the conversation. An engineering manager can walk into a retro with data showing that 40% of total cycle time sits in the pickup stage, and the team can fix reviewer routing instead of guessing. Teams that act on this data have achieved up to 59% faster cycle times.
Flat pricing with no credit surprises
LinearB's credit system means your monthly bill depends on how many PRs trigger automations. For teams running heavy automation, the number can shift meaningfully from month to month.
DevStats charges a flat per-contributor rate. Starter is $15/month. Pro is $27/month. There are no credits, no automation surcharges, and no cost variability based on PR volume. A team of 40 on the Starter plan pays $7,200/year. The same team on LinearB's Essentials plan pays $13,920/year before credits.
That predictability matters when you are defending a budget line to finance.
AI coding tool ROI across six tools, not a partial view
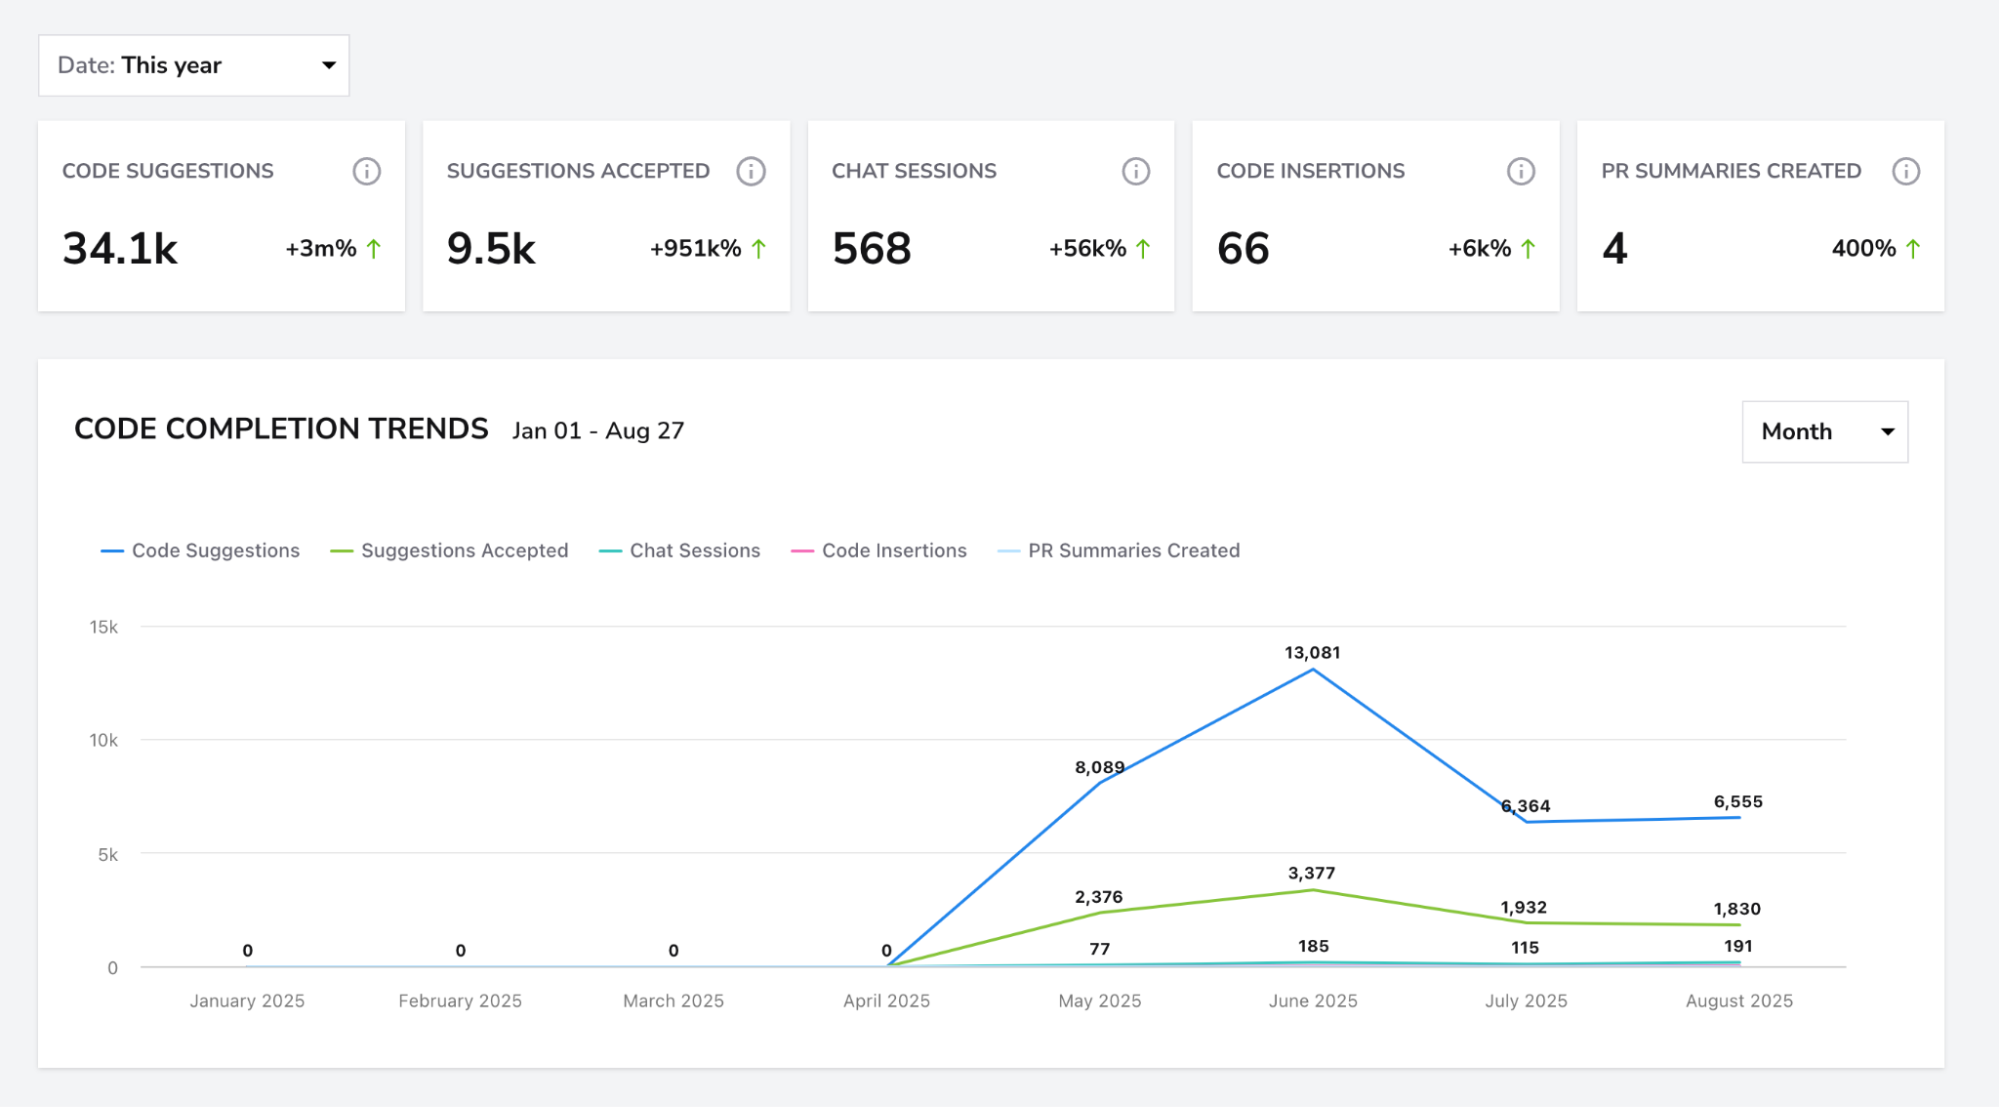
LinearB offers partial AI impact tracking. DevStats's AI Impact report covers six tools: GitHub Copilot, Cursor, Claude Code, Amazon Q, Cody, and Windsurf. It tracks what actually changes when developers use these assistants, including PR volume, velocity shifts, review time, and code quality scores.
Across DevStats customers, AI-assisted PRs show an average velocity impact of +24%.
That breadth matters because engineering teams rarely standardize on a single AI coding tool. If half your team uses Copilot and the other half uses Cursor, you need a platform that measures both in the same dashboard.
Engineering allocation data that answers the CEO's question
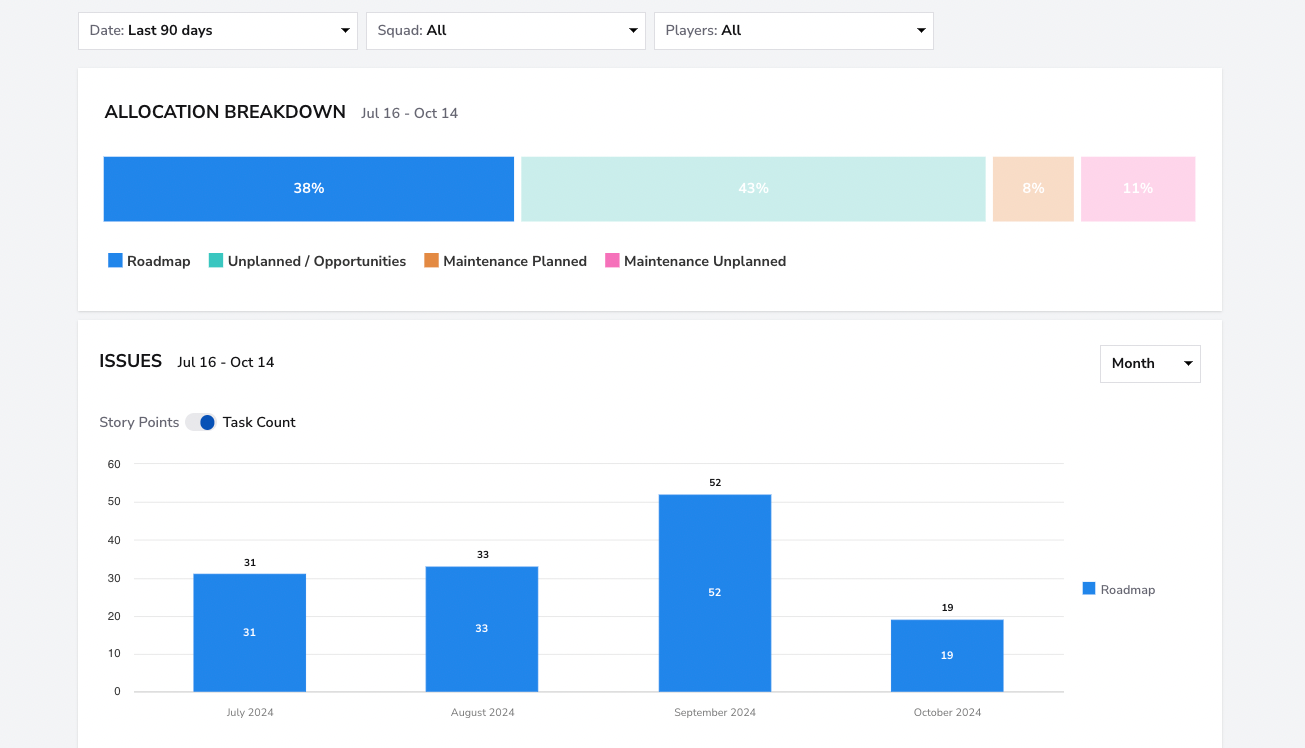
The question that triggers a tool purchase is often, "why are we only shipping two features this quarter when we have 20 developers?" LinearB tracks engineering allocation, but it sits behind the higher-priced tiers alongside automation features.
DevStats's Allocation dashboards are available on all plans. They break work into features, enhancements, maintenance, and productivity categories, giving engineering leaders a clear picture of where time goes.
Teams that use allocation data to shift away from unplanned reactive work have recovered up to 75% more bandwidth for planned roadmap delivery.
DORA metrics with external benchmarks
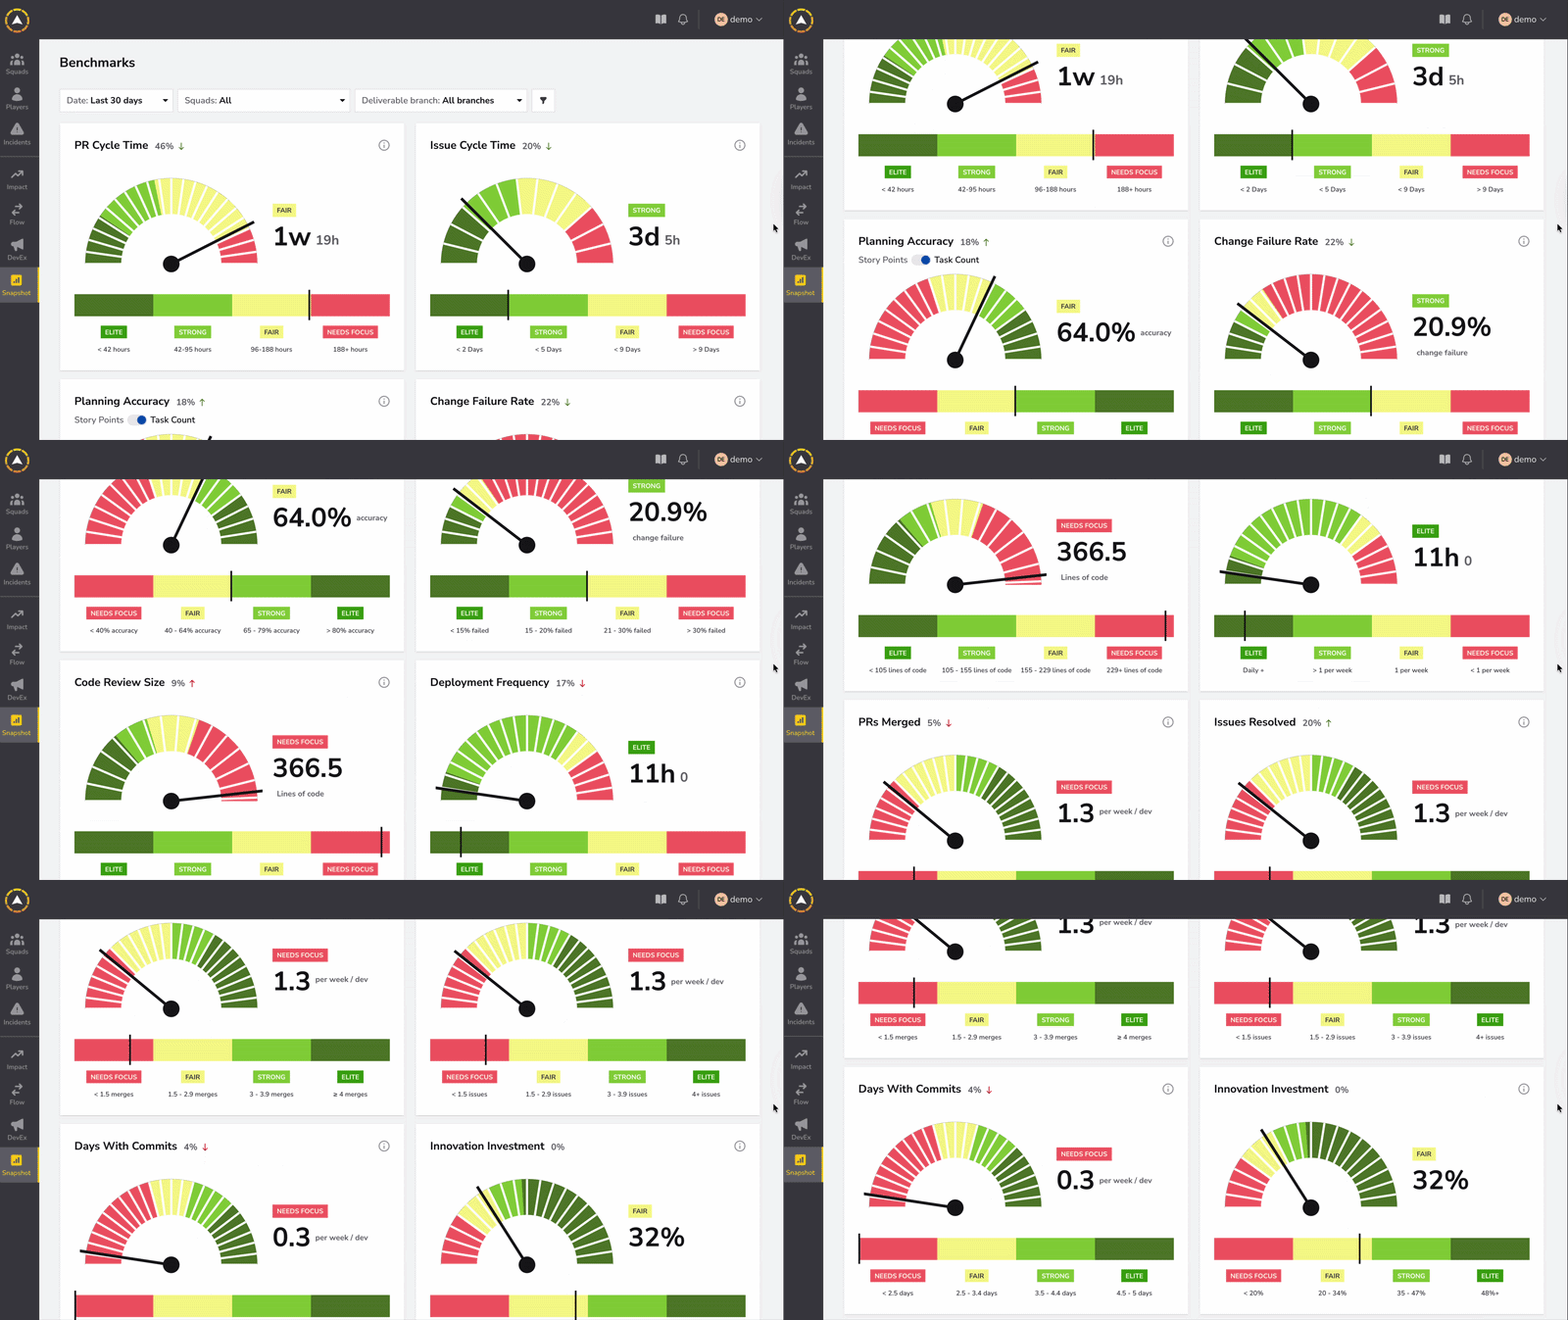
Both LinearB and DevStats track DORA metrics. The difference is context. DevStats benchmarks your team against 1,000+ engineering organizations and assigns an Elite, High, Medium, or Low tier automatically.
That benchmark turns internal numbers into a meaningful signal. For teams getting started with DORA, the external comparison gives the data immediate credibility with leadership.
DevStats Pricing
- Starter at $15/month per contributor
- Pro at $27/month per contributor (billed annually), with a dedicated Slack channel for hands-on support
- Enterprise with custom pricing for larger organizations and tailored integrations
At $180/year per contributor on Starter, that is roughly what you pay a developer for two weeks. The platform pays for itself the first time it helps you find and fix a delivery bottleneck.
How to get started with DevStats
You can be looking at real data in five minutes. Point DevStats at your Git provider and issue tracker, and it backfills up to three years of history on its own. There is nothing to install, no code to change, and no onboarding project to schedule.
Teams can start a 14-day free trial, self-serve, no demo required, or can contact us and book a demo to walk through the dashboards against their actual stack first.
Alternative #2: Jellyfish
Best for: Enterprise engineering organizations (200+ developers) that need R&D cost capitalization and board-level financial reporting, and have the budget and implementation timeline to support it.
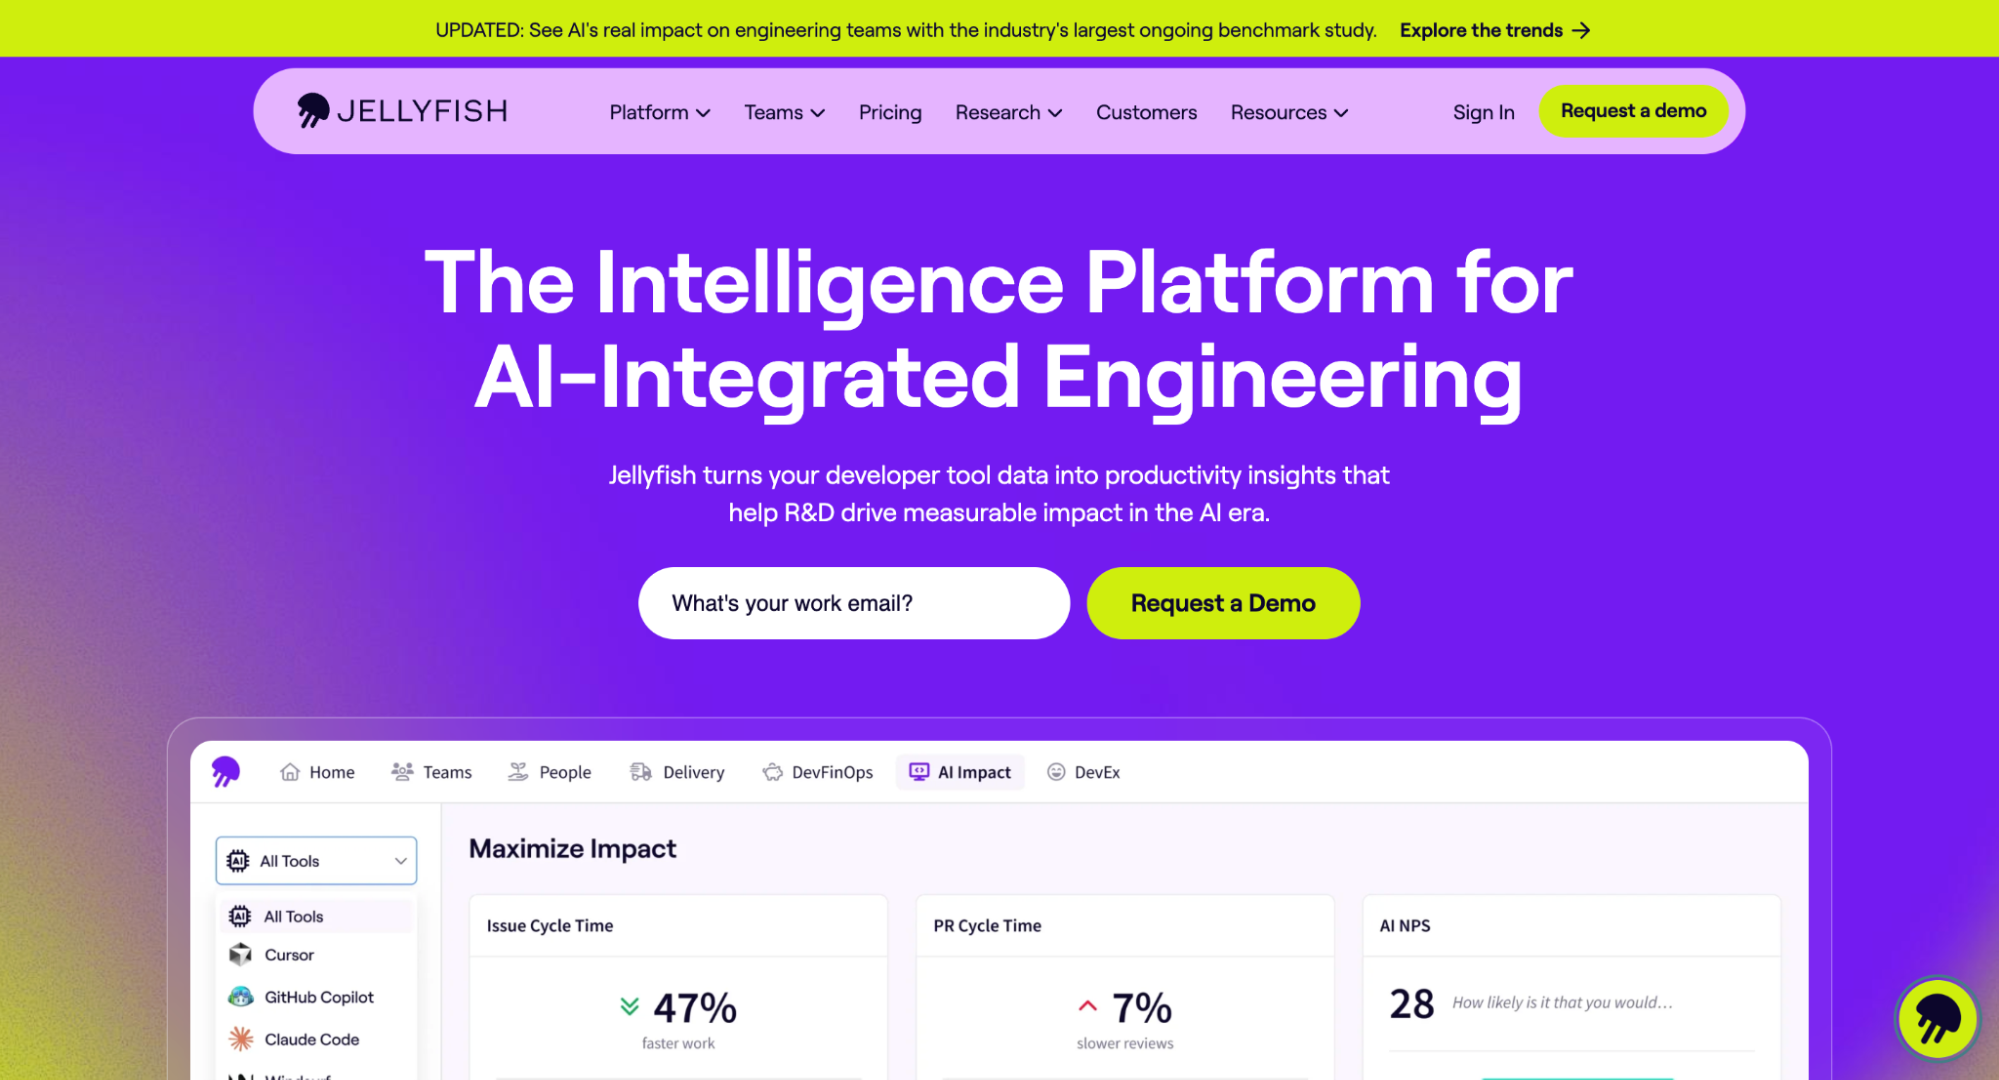
The tradeoff is steep. Contracts start at $100K+ per year with multi-year commitments. Implementation takes weeks to months. And for the engineering managers and dev leads who use LinearB day-to-day, Jellyfish's operational views tend to be shallower.
You gain executive reporting but lose the granular delivery data.
Features
- Engineering investment allocation and capacity planning
- R&D cost capitalization reporting
- DORA metrics and lifecycle tracking
- Developer experience surveys
- AI impact measurement for Copilot, Cursor, and Amazon Q
- Scenario modeling for resource planning
- Pricing starts at $100K+/year; contact sales for a quote
Alternative #3: Swarmia
Best for: Developer-first teams that care more about developer experience measurement than the workflow automation that LinearB charges a premium for.
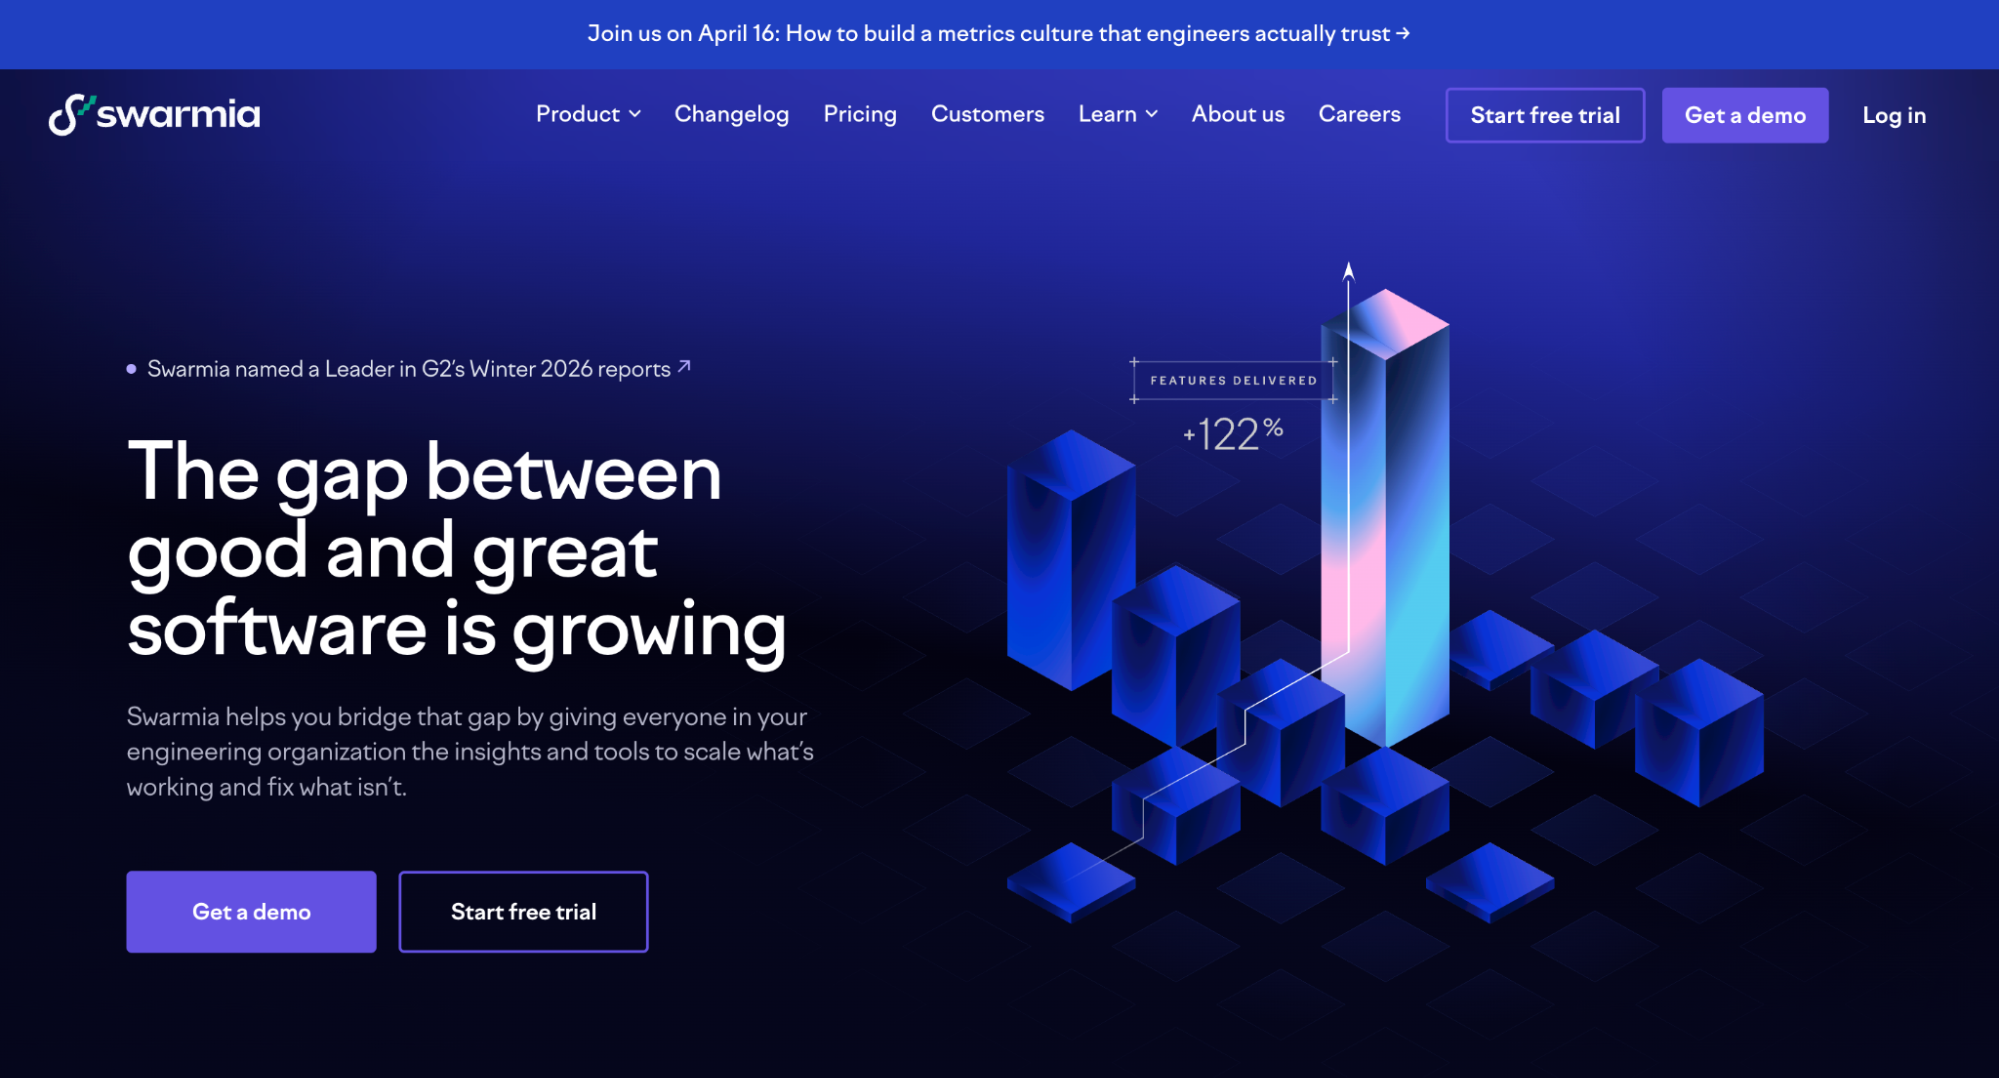
Swarmia approaches engineering intelligence from the opposite direction as LinearB. Where LinearB adds value through automation (gitStream, WorkerB bots, programmable PR workflows), Swarmia adds value through developer experience signals: built-in surveys, working agreements, and team health tracking alongside DORA metrics.
If the reason you are looking beyond LinearB is that your team views it as a management tool rather than something developers benefit from, Swarmia is designed to close that gap.
The UI is among the cleanest in this space, and the working agreements feature lets teams set their own norms around PR size and review turnaround.
Two gaps worth knowing: Swarmia has limited US market presence, and it has no AI Impact tracking across AI coding tools. For teams that have rolled out Copilot or Cursor and need to measure ROI, that is a real gap in 2026.
Features
- DORA metrics and cycle time tracking
- Code review analytics and working agreements
- Developer experience surveys
- Per-developer pricing model
- GitHub, GitLab, and Jira integrations
- Pricing from $23/dev/month (single module) to $45/dev/month (Standard, all three modules), billed annually; free up to 9 developers; Enterprise custom
Alternative #4: Hatica
Best for: Budget-conscious teams that want broader tool integration than LinearB offers at a lower per-seat cost, and where deep cycle time granularity is a lower priority.
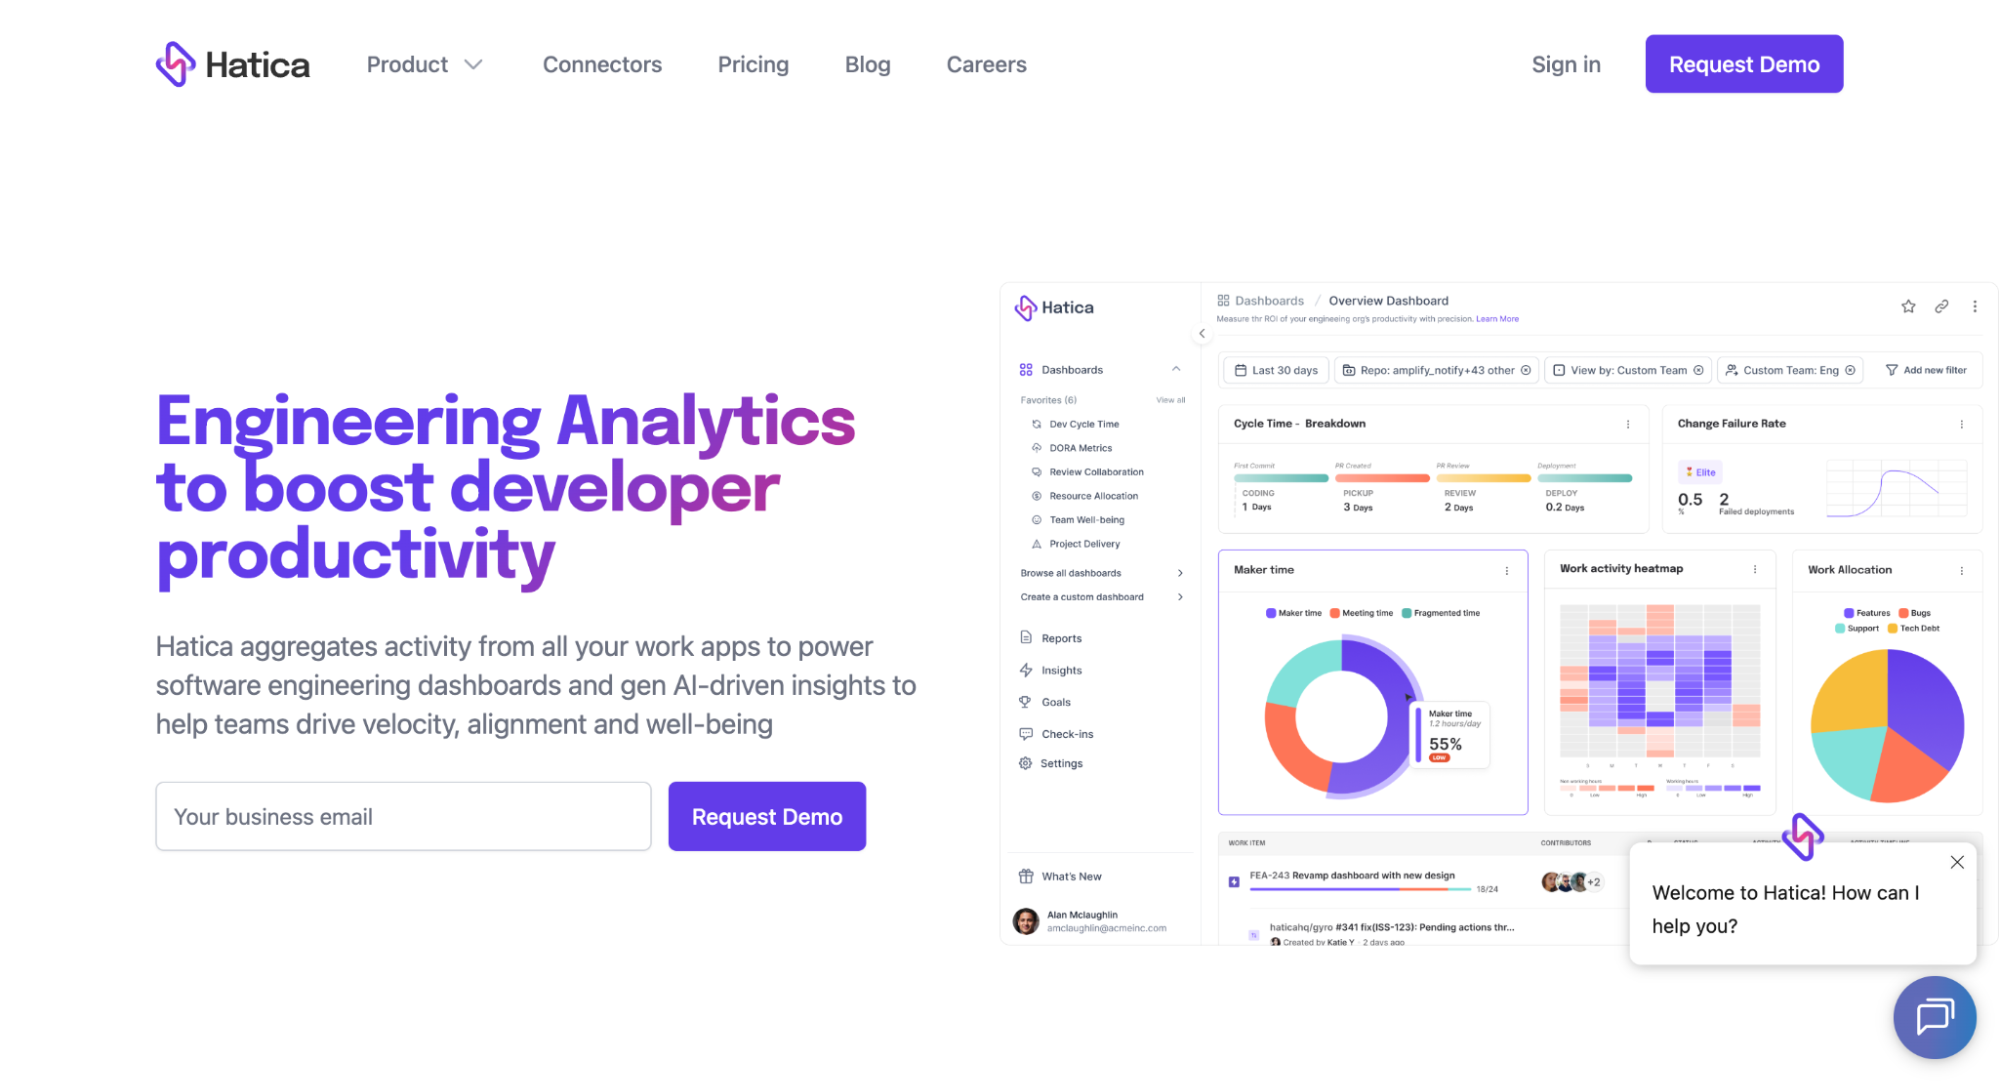
LinearB integrates with GitHub, GitLab, Jira, and CI/CD pipelines. Hatica extends that integration set to include Slack, PagerDuty, and additional collaboration tools, pulling activity data from more sources into a single view.
The price is also lower. Hatica's Pro plan is $19/member/month and Business is $29/member/month, both billed monthly rather than annually. The free tier includes unlimited members with activity dashboards and DevEx surveys, giving teams a genuine starting point that LinearB does not offer.
The tradeoff is depth. Hatica's cycle time and code review analysis are shallower than what LinearB provides, and significantly shallower than DevStats's 5-stage PR breakdown. Engineering managers trying to diagnose what is slowing down code review cycles will find the data less actionable.
If you need breadth across tools at a low price, Hatica works. If you need granularity to drive process changes, it may not be enough.
Features
- Engineering metrics dashboards
- DORA metrics and SPACE framework alignment
- Developer wellbeing tracking and maker time measurement
- Broad tool integration coverage
- Team reporting
- Free tier with activity dashboards, DevEx surveys, and async standups (unlimited members); Pro at $19/member/month; Business at $29/member/month; Enterprise custom
Alternative #5: GitClear
Best for: Teams where AI-generated code quality is the primary concern, and where the code-level depth that LinearB lacks matters more than the delivery context LinearB provides.
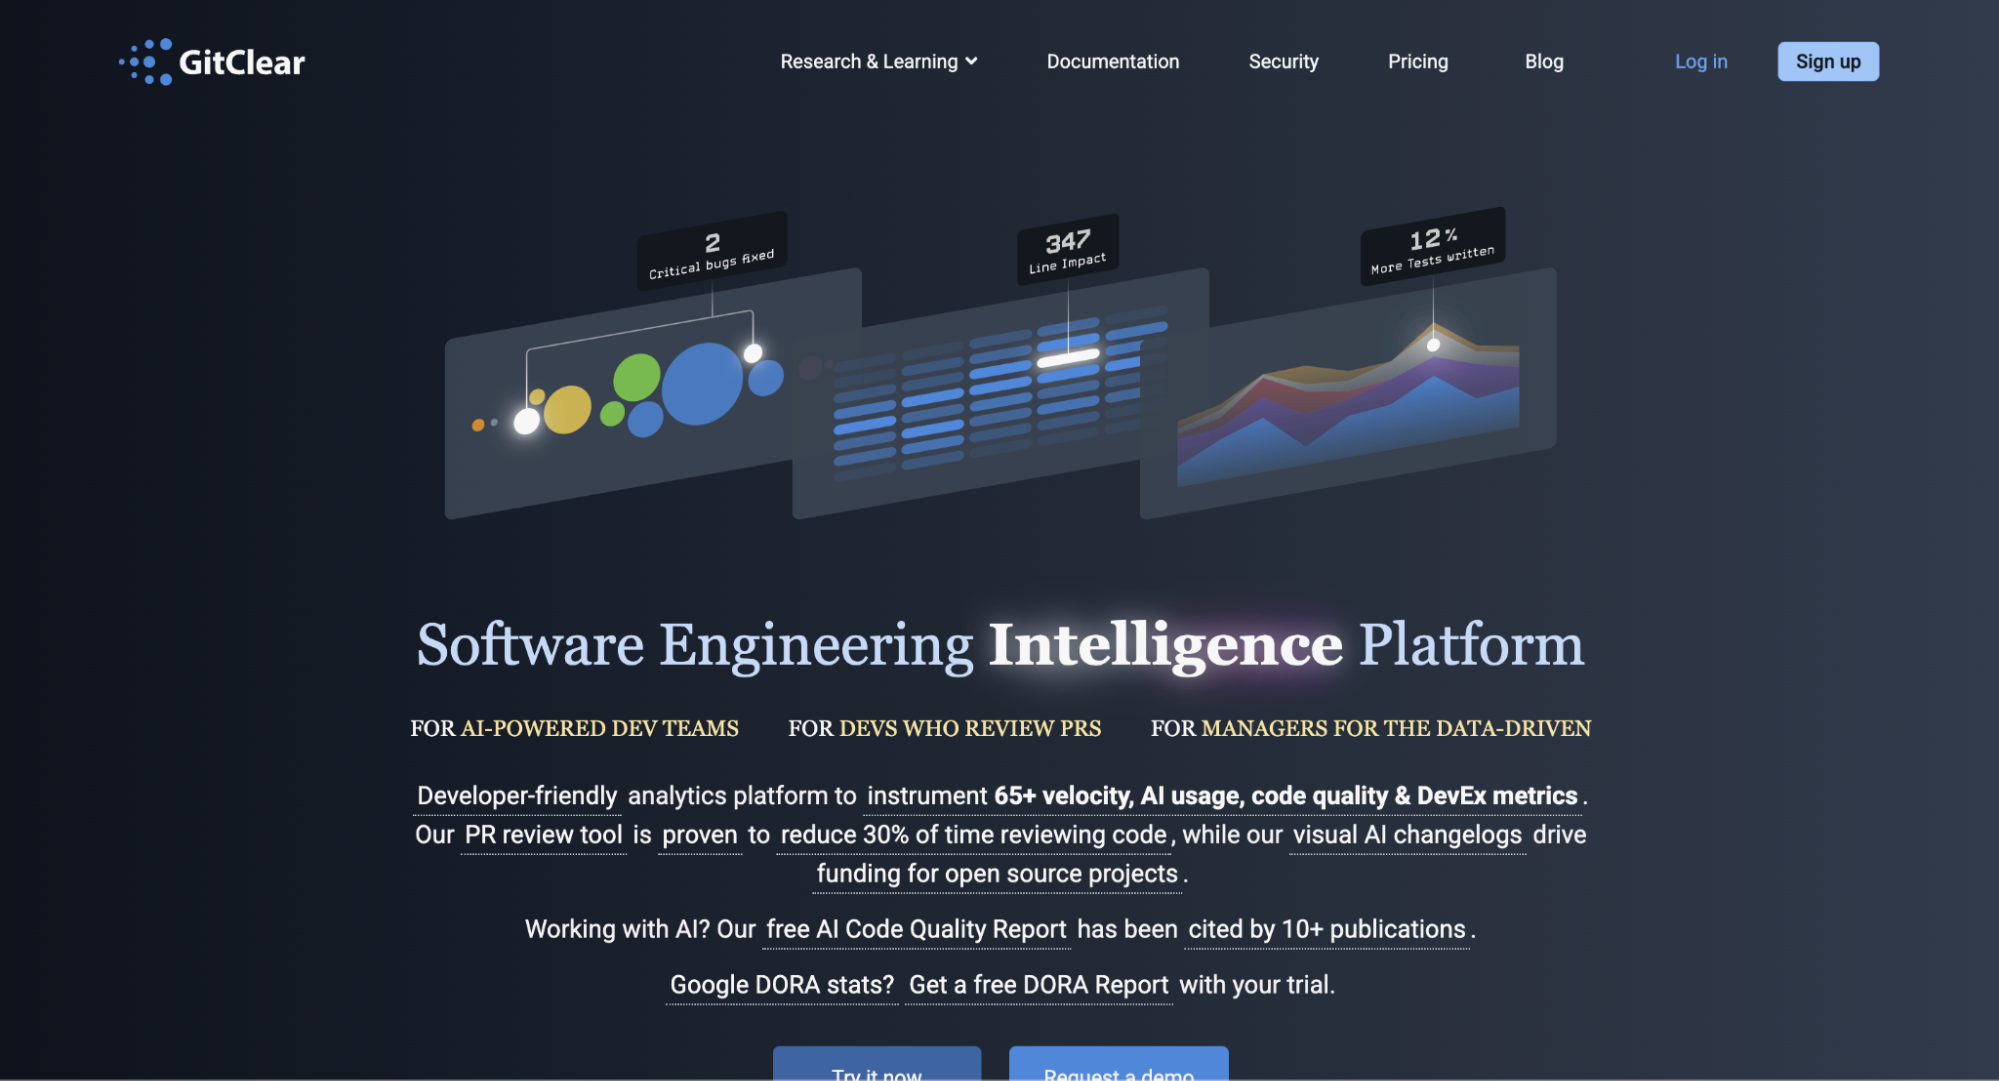
LinearB tracks engineering metrics at the workflow level: PR cycle time, sprint velocity, deployment frequency. GitClear goes a layer deeper into the code itself.
Its Diff Delta metric measures actual developer effort more accurately than lines of code, and its AI Code Quality tracking monitors what happens to code written by Copilot, Cursor, and Claude over time.
GitClear's research on AI-generated code churn is some of the most rigorous in the field. If your team has rolled out AI coding tools and needs to verify that the generated code is holding up in production, GitClear gives you data that LinearB does not surface.
The gap is scope. GitClear is Git-only. No issue tracker integration means you lose the delivery context that LinearB, DevStats, and Swarmia provide. You cannot see sprint progress or engineering investment allocation without connecting to another tool.
Features
- 65+ engineering metrics covering velocity, AI usage, code quality, and developer experience
- Diff Delta metric for measuring actual developer effort
- PR review tool with a claimed 30% reduction in review time
- Tech Debt Inspector for identifying problem directories
- AI Code Quality tracking across Copilot, Claude, and Cursor
- DORA metrics and cohort reports
- GitHub, GitLab, Bitbucket, and Azure DevOps integrations
- Pricing: free Starter plan; Pro at $14.95/contributor/month; Elite at $24.95/contributor/month; Enterprise at $34.95/contributor/month
Alternative #6: Pluralsight Flow
Best for: Engineering teams already locked into a Pluralsight subscription who want basic engineering metrics without adding another vendor, and who do not need the depth that LinearB or DevStats provide.
Pluralsight Flow and LinearB share a common ancestor. LinearB's founders came from the engineering intelligence space, and Pluralsight Flow (originally GitPrime) was one of the earliest tools in the category.
Flow has changed ownership three times. The UI is dated, the setup is more complex than modern alternatives, and the product roadmap has stalled.
It covers Git-based metrics and DORA tracking, but it lacks the PR automation that makes LinearB appealing to larger teams. It also lacks the cycle time granularity that makes DevStats useful for engineering managers.
If you are already paying for Pluralsight's learning platform and want basic metrics bundled in, Flow provides that. If you are evaluating fresh, there are better options at every price point.
Features
- Git-based engineering metrics
- DORA metrics tracking
- Code review analytics
- Bundled with Pluralsight learning platform
- Pricing is bundled with a Pluralsight subscription; contact sales for current rates
Alternative #7: Waydev
Best for: Teams evaluating engineering metrics tooling for the first time that want to validate a platform against their real data before committing, and where LinearB's focus on PR automation is not a fit.
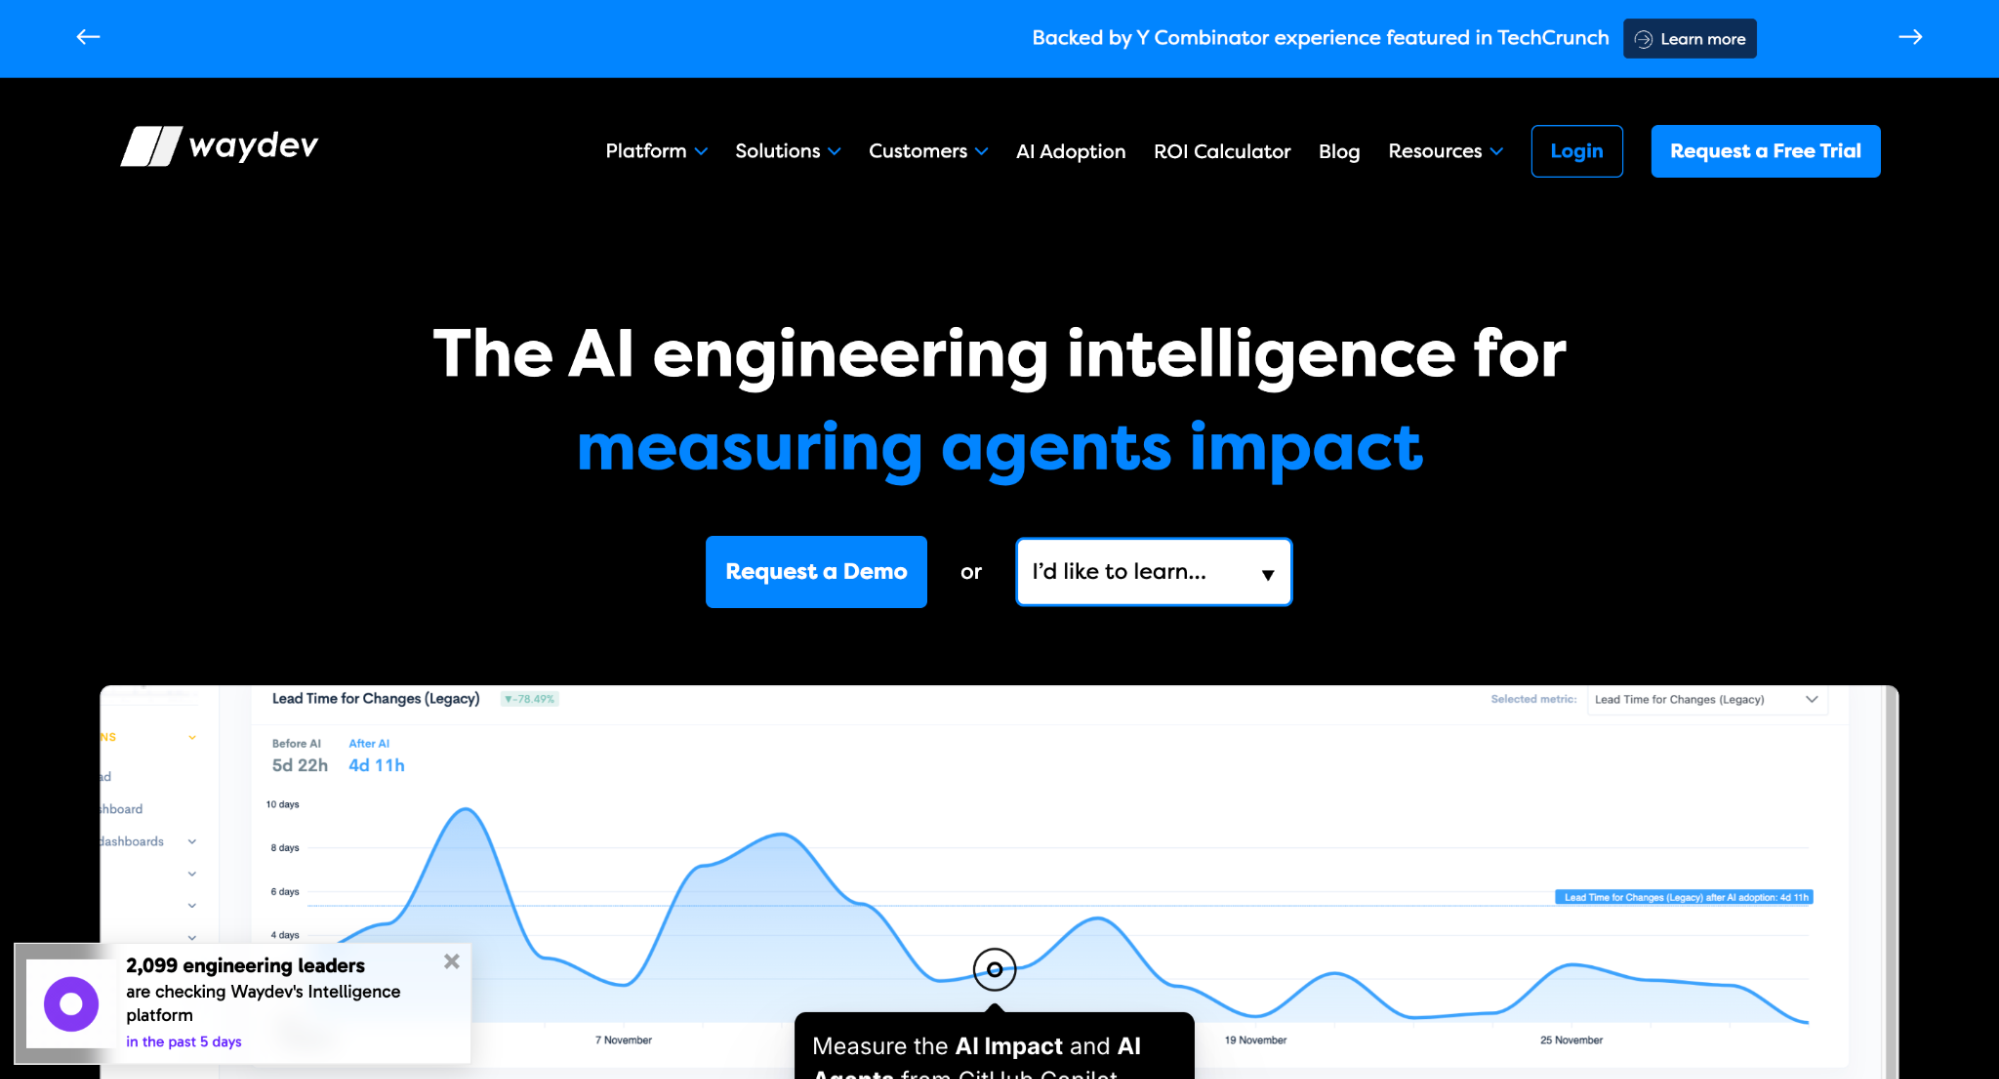
Waydev and LinearB overlap on engineering performance dashboards and delivery visibility. Waydev's differentiator is its POC trial process, which lets teams test the platform against their actual data before purchasing. For organizations that need internal buy-in before committing budget, that lower-risk evaluation path can be the deciding factor.
The experience is less polished than LinearB or DevStats. Waydev has not kept pace with AI Impact tracking or a granular PR cycle time breakdown, which limits its utility for teams with those specific needs.
Its pricing also lands in a similar range to LinearB ($29 to $54/contributor/month billed annually), so the cost savings are minimal.
Features
- Engineering performance dashboards
- Git and issue tracker integrations (GitHub, GitLab, Bitbucket, Azure DevOps, Jira, ClickUp)
- Developer experience module
- AI-powered team insights
- POC trial before purchase
- Pricing from $29/contributor/month (Pro) to $54/contributor/month (Premium), billed annually; Enterprise custom
Alternative #8: Allstacks
Best for: Large organizations (100+ engineers) where the primary pain is missed delivery deadlines, and where LinearB's metrics are useful but its predictive capabilities are not deep enough.
LinearB provides delivery metrics and forecasting features on its Enterprise plan. Allstacks makes prediction its central value proposition. Its ML-based Deep Risk Alerts flag projects that are likely to slip before they actually do, based on patterns across the value stream.
If your team uses LinearB today and the main frustration is that you see delivery problems after they have already happened, Allstacks targets that gap directly.
The tradeoff is that Allstacks is narrower on day-to-day engineering metrics. The depth on code review patterns and PR-level cycle time analysis is limited compared to LinearB, DevStats, or GitClear.
It works best as a portfolio-level forecasting layer for engineering leadership, not as a replacement for a team-level delivery analytics tool.
Features
- DORA metrics and pipeline analytics
- ML-based Deep Risk Alerts for predicting delivery delays
- Portfolio-level visibility and investment alignment
- Developer experience surveys
- Enterprise pricing; contact sales
Alternative #9: Nave
Best for: SMB teams running Kanban that need lightweight flow analytics from their issue tracker and do not need the Git-level visibility that LinearB provides.
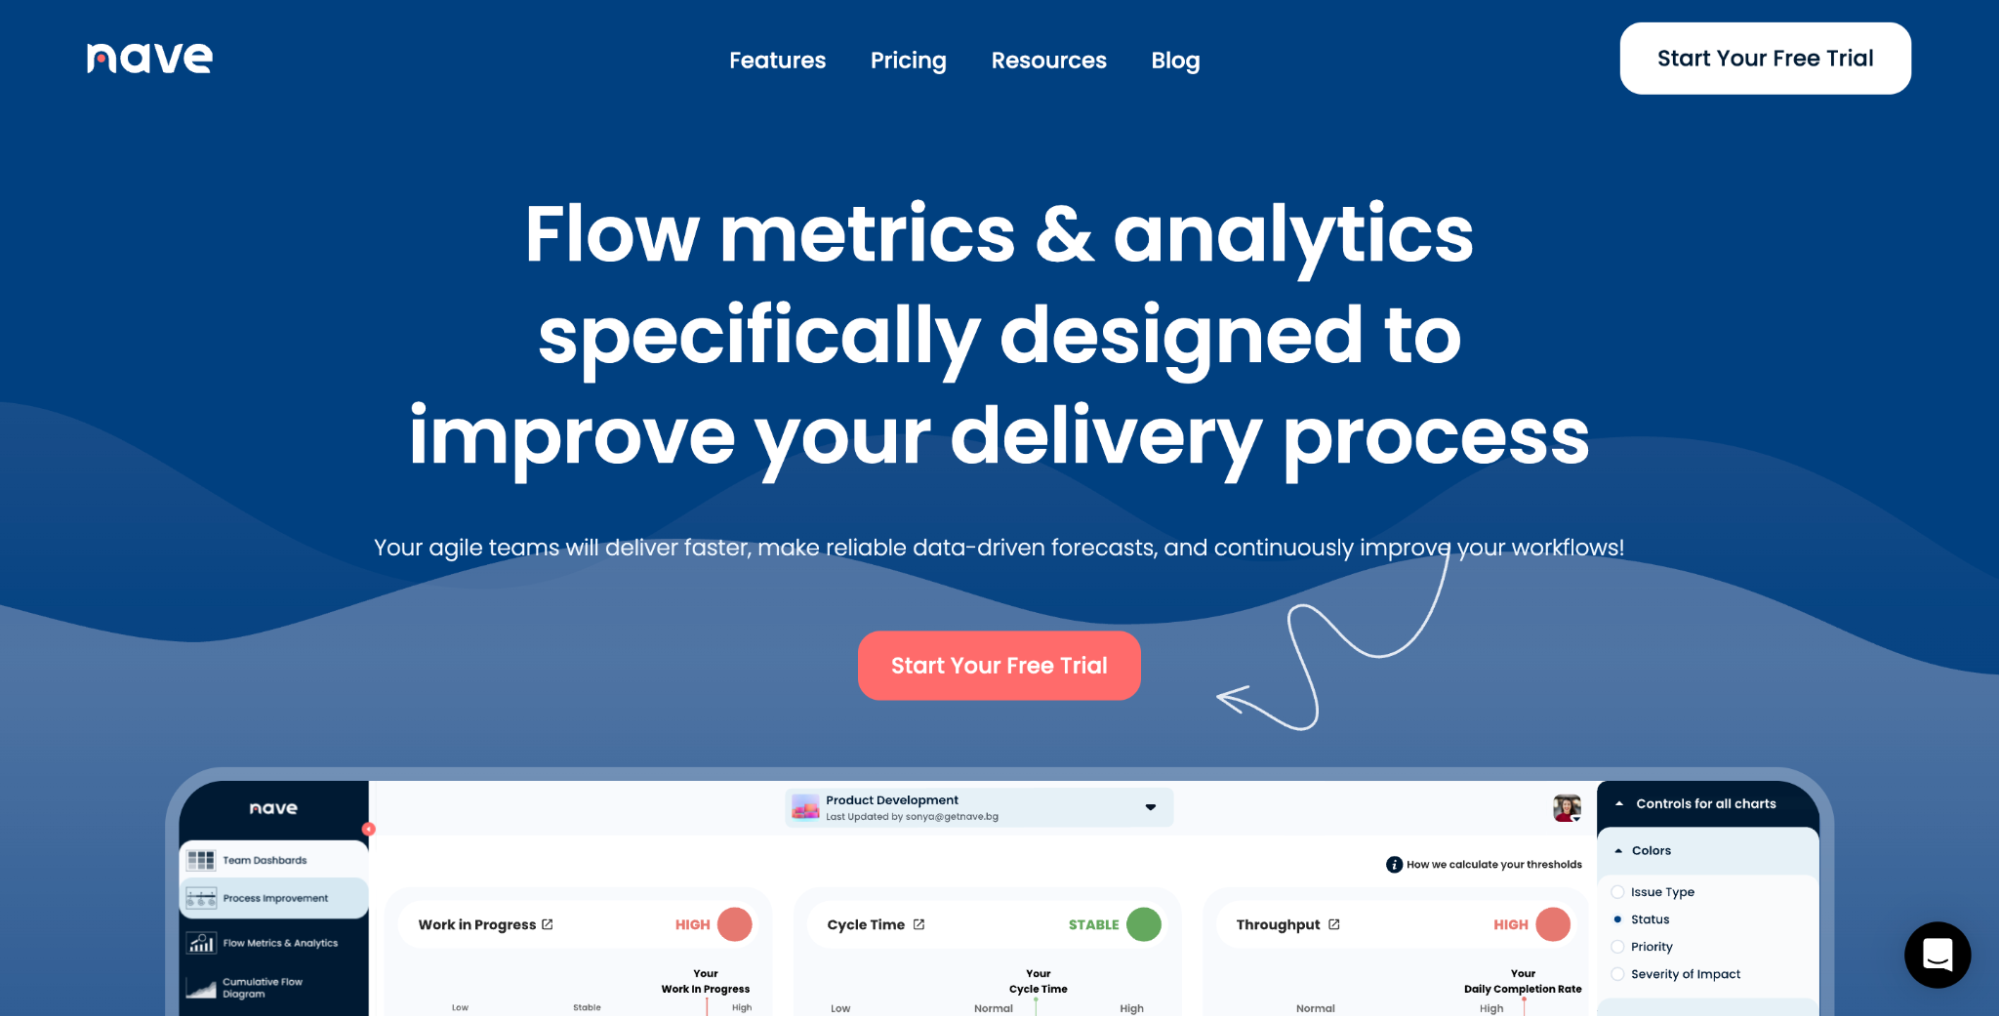
Nave solves a fundamentally different problem than LinearB. It connects to Jira, Azure DevOps, and Trello and provides Kanban flow metrics: cycle time scatterplots, throughput tracking, Monte Carlo forecasting, and aging work-in-progress tracking.
It does not touch Git data, does not measure DORA metrics from code, and does not analyze pull requests. If your team runs Kanban and you want flow analytics from your issue tracker, Nave is inexpensive and focused.
If you are looking to replace LinearB, Nave is not a like-for-like substitute. It covers a different layer of the stack. Some teams use it alongside a Git-level platform for complementary visibility.
Features
- Cycle time scatterplots and histograms
- Throughput tracking and Monte Carlo forecasting
- Aging work-in-progress tracking
- Flow efficiency measurement
- Jira, Azure DevOps, Trello, and Asana integrations
- Pricing starts at $59/month for 2 boards (annual billing); scales by number of boards, not users
Alternative #10: Sleuth
Best for: DevOps-mature teams that need more accurate DORA metrics than LinearB provides, measured from actual deploy events rather than inferred from Git activity.
LinearB, like most tools in this category, infers deployments from Git commit and merge patterns. Sleuth takes a different approach: it tracks actual deploy events from your CI/CD pipeline, which produces cleaner, more accurate DORA numbers.
For teams with mature CI/CD pipelines where DORA accuracy is the top priority, Sleuth fills a gap that LinearB leaves open. The difference shows up most in change failure rate and deployment frequency, where inference-based tools can overcount or undercount depending on branching strategy.
The tradeoff is breadth. Sleuth does not offer engineering investment allocation, AI impact tracking, or code review visibility at the level that LinearB or DevStats provide. It is a specialist, and a good one, but replacing LinearB with Sleuth alone would mean losing most of your current metric coverage.
Features
- Deploy-event-accurate DORA metrics
- Change failure rate tracking tied to actual incidents
- Deployment frequency measured from real deploys
- Automations for deploy-related workflows
- Slack integration for deploy notifications
- GitHub, GitLab, Bitbucket, and CI/CD pipeline integrations
- Sleuth's DORA product pricing is not publicly listed; contact sales or book a demo for current rates
What is the best LinearB alternative?
| DevStats | Jellyfish | Swarmia | GitClear | Hatica | LinearB | |
|---|---|---|---|---|---|---|
| Pricing | From $15/dev/month | $100K+/year | From $23/dev/month | From $14.95/dev/month | Free tier available | From $29/dev/month |
| Setup time | Under 2 minutes | Weeks to months | Hours to days | Hours | Hours | Hours to days |
| DORA metrics | Yes, benchmarked | Yes | Yes | Yes | Yes | Yes |
| 5-stage PR breakdown | Yes | No | No | No | No | No |
| AI tool ROI tracking | Yes, 6 tools | Yes | No | Deep code analysis | Limited | Partial |
| Engineering allocation | Yes | Yes | Partial | No | Limited | Yes |
| Developer surveys | No | Yes | Yes | No | Yes | No |
| R&D capitalization | No | Yes | No | No | No | No |
| SOC 2 Type II | Yes | Yes | Yes | No | No | Yes |
| Credit-based billing | No | No | No | No | No | Yes |
| Workflow automation | No | No | Working agreements | No | No | Yes (gitStream) |
| Free trial | Yes, 14 days | Demo only | Yes | Yes | Yes | Yes |
| Ideal team size | 15+ devs | 200+ devs | 20 to 100 devs | Any size | 15 to 100 devs | 50 to 200 devs |
How to choose the right platform for your team
A few questions that tend to separate the right tool from the wrong one quickly.
Do you actually need workflow automation?
This is the first question because it determines whether you need something like LinearB at all. If gitStream, WorkerB bots, and programmable PR routing are features your team actively uses and values, the alternatives on this list trade away that automation for lower cost, simpler setup, or deeper metrics.
If those features are sitting unused in your LinearB account, you are paying for automation overhead and should prioritize metric depth and pricing instead.
What is your team size?
The 15+ developer range is where DevStats, Swarmia, and Hatica compete most directly with LinearB. Below 15, GitClear's free Starter plan covers the basics without cost.
Above 200, the financial reporting and capitalization features of Jellyfish start to earn their price. LinearB also targets the upper end of this range with its Enterprise plan.
How urgent is AI coding tool ROI?
If you have already deployed Copilot or Cursor and need to show impact to leadership, that narrows the field. DevStats tracks ROI across six AI tools. GitClear offers deep AI code quality analysis at the code level. LinearB offers partial tracking. Swarmia, Hatica, and Nave do not cover this area.
For teams still establishing their baseline metrics, starting with DORA is usually the fastest path to credibility with leadership.
Is developer experience measurement a priority?
LinearB does not include developer surveys. If you want to combine system metrics with self-reported developer data, Swarmia is the strongest option with survey infrastructure built in. Jellyfish also offers DevEx surveys at the enterprise level.
Delivery-focused platforms like DevStats and GitClear rely on behavioral signals from Git and issue trackers instead.
Does pricing predictability matter?
LinearB's credit model means your bill fluctuates with PR automation volume. If your finance team needs a fixed line item, platforms with flat per-contributor pricing (DevStats, GitClear, Hatica) remove that variable.
Jellyfish and Allstacks use enterprise contracts, which are predictable but require annual commitments and start significantly higher.
How long can you wait to see data?
LinearB takes hours to days to configure, depending on your stack and the number of integrations. If the answer is "we need something this week," Jellyfish is off the table entirely, and Swarmia takes a few hours depending on the stack.
DevStats connects in under 2 minutes. Hatica and GitClear are also fast. Before booking demos, getting clear on which metrics actually drive delivery decisions saves time during evaluation.
Getting started with DevStats
If you have read this far, you know what matters to your team and what LinearB is not delivering on. DevStats is the fastest way to test whether a different platform closes that gap.
There is no data migration from LinearB. DevStats connects to the same source tools your team already uses and pulls up to three years of history automatically. Most teams see live data the same day they connect.
Start a 14-day free trial with no credit card required, or contact us if you want a guided walkthrough against your team's actual stack first.
Frequently asked questions
What are the main reasons engineering teams look for LinearB alternatives?
Pricing, complexity, and fit. LinearB's credit-based billing model adds unpredictable costs on top of per-seat fees, which makes budgeting difficult for growing teams.
The platform is also built around workflow automation. Engineering managers who want delivery metrics and DORA benchmarking without configuring programmable PR workflows end up paying for capabilities they do not use.
Can I migrate from LinearB to another platform without losing historical data?
Yes. Platforms like DevStats, Swarmia, and Hatica connect directly to your source tools (GitHub, Jira, etc.) and pull historical data from those systems. DevStats loads up to three years of history automatically.
No CSV export, no data mapping, no implementation timeline. The new platform reads from the same repos and issue trackers that LinearB was connected to.
Does DevStats replace Jira or Linear?
DevStats sits on top of whatever project management tool your team already uses. It connects to Jira, Linear, and ClickUp, then surfaces delivery patterns those tools cannot show on their own: how cycle time trends over time, how much scope creep affects each sprint, and how often work carries over.
Your team's day-to-day workflow stays exactly the same.
How do engineering teams handle the surveillance concern when switching tools?
The concern tends to resurface any time a new metrics platform is introduced, even if the team was already using LinearB. DevStats is built on the SPACE framework and measures team-level processes. No individual developer rankings. No comparative scoring between team members.
The engineering manager uses the data to diagnose team delivery patterns, decide on interventions, and then measure whether those interventions worked. When teams see metrics as a shared language between engineering and the business, adoption tends to be smoother than the initial rollout of LinearB was.