
Jellyfish starts at $100K+ per year, which ends the conversation for most growth-stage SaaS teams before it begins.
Those who get through the sales process hit a different set of problems: rigid reporting, limited day-to-day utility for engineering managers, and a platform built for finance teams rather than the people managing delivery.
This guide covers eight Jellyfish alternatives for engineering teams in 2026, with clear tradeoffs on pricing, depth, and fit by team size.
Key takeaways
-
Jellyfish is built for enterprise organizations that need R&D cost capitalization and executive-level financial reporting. Growth-stage SaaS teams end up paying for features they will never use, sitting through onboarding cycles that stretch months.
-
The strongest Jellyfish alternatives differ by what they prioritize: some prioritize developer experience surveys, others focus on delivery flow, and others, like DevStats, are built so an engineering manager can get answers without hiring an analyst or waiting months for implementation.
-
Team size matters more than pricing when choosing a platform. A platform designed for a 500-person engineering org will overwhelm a team of 30-50 with configuration and features they will never touch.
-
DevStats gives VPs of Engineering and engineering managers a shared language between the engineering org and the business, with DORA metrics, PR cycle time breakdowns, AI coding tool ROI, and engineering investment visibility. Contact us to see it against your team's actual stack.
Why look for a Jellyfish alternative?
Jellyfish is a capable platform, and for publicly traded companies that need R&D cost capitalization and board-level engineering reporting, it earns its price. For everyone else, the fit breaks down quickly.
These are the four complaints that come up most often.
-
Price. At $100K+ per year with multi-year contracts, it prices out most Series A and Series B companies before the evaluation starts.
-
Implementation time. Fully configuring Jellyfish takes weeks to months. Most alternatives on this list connect in minutes.
-
Executive-only focus. G2 reviewers flag that day-to-day views are shallow. The platform serves boards and finance teams well. Engineering managers often find the operational detail missing.
-
No self-serve path. Jellyfish requires a demo before you can access the product. For teams that want to evaluate against their own data before committing, that is a real friction point.
Alternative #1: DevStats
Best for: Growth-stage SaaS companies with 15+ developers that have outgrown gut-feel engineering management but are not large enough to justify a six-figure enterprise contract.
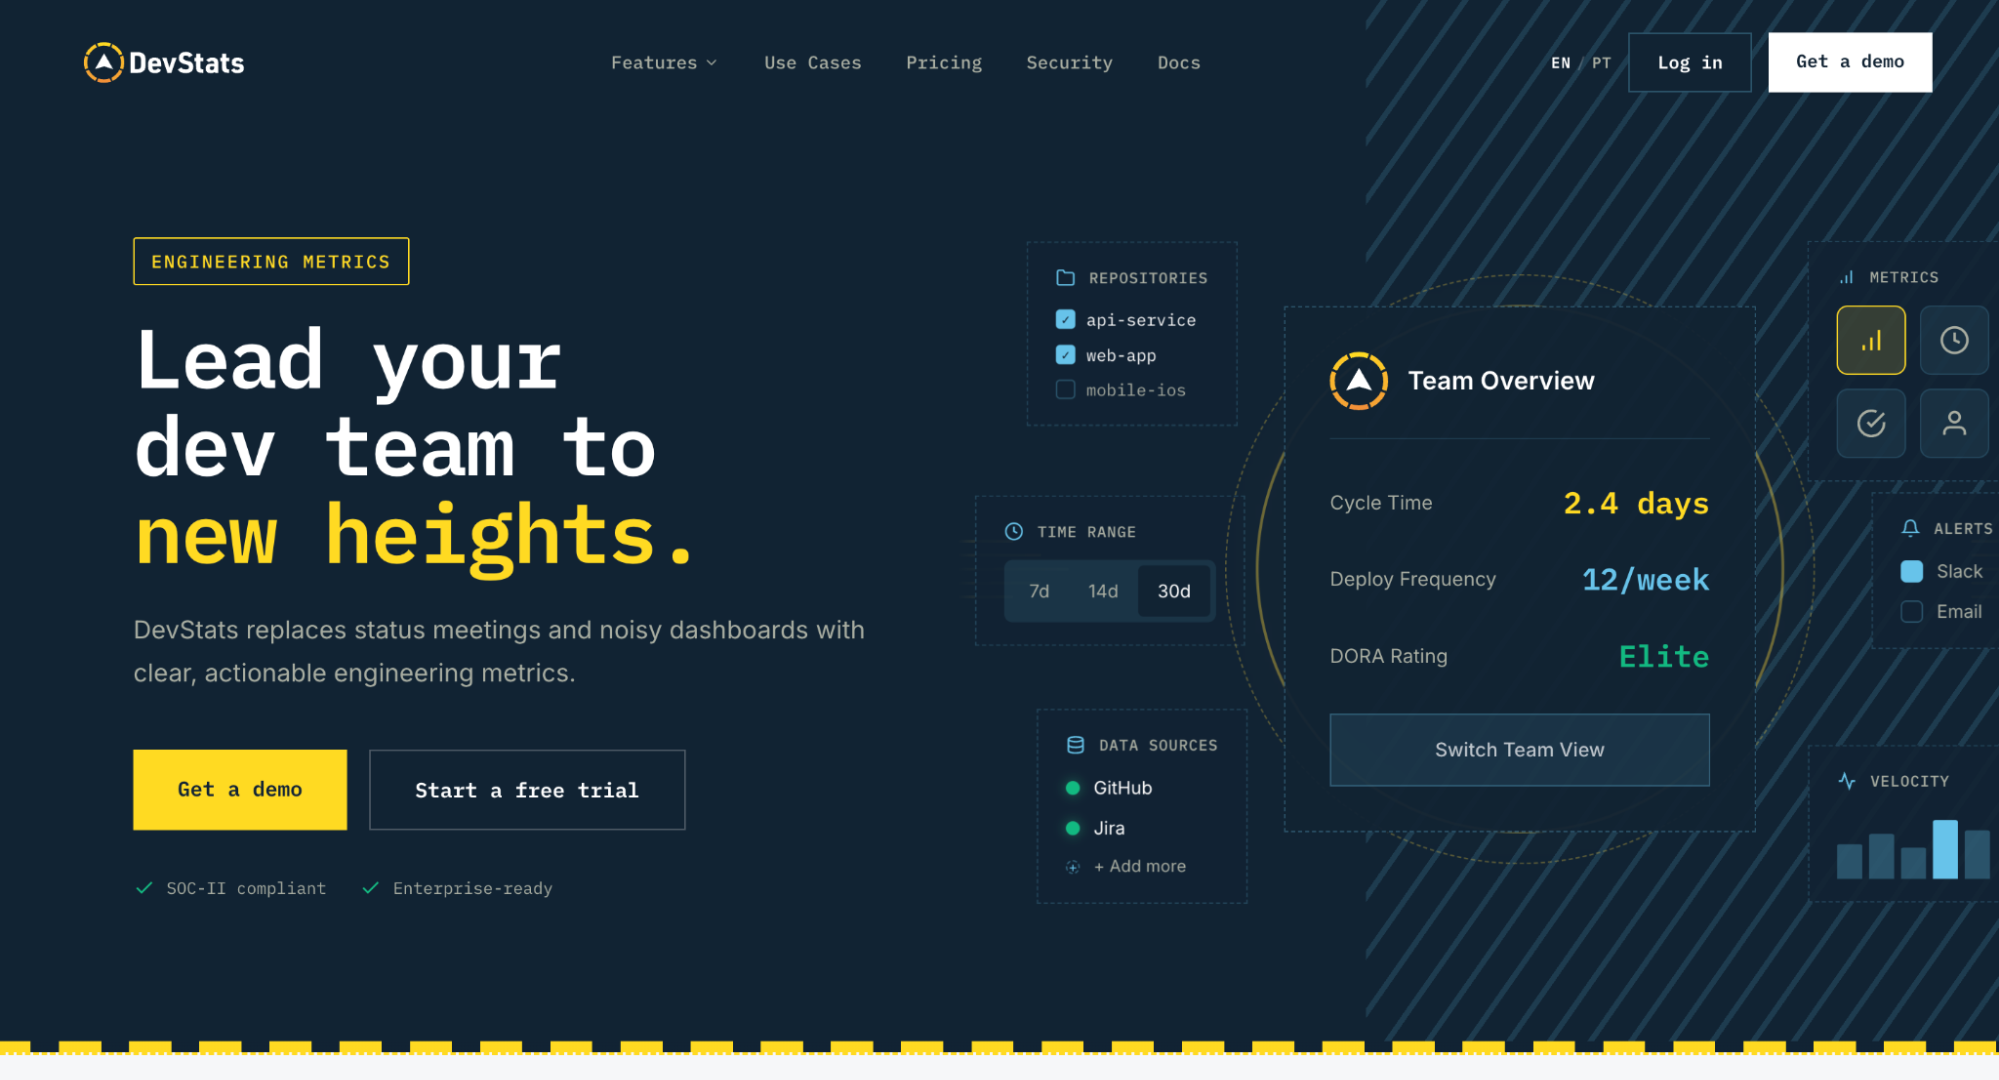
DevStats exists because the team that built it got burned by the tools they were paying for.
The engineering leads at DevSquad, a software development agency, relied on third-party platforms to track delivery performance across client projects. When those products changed hands and declined, they stopped waiting for someone else to fix the problem and built their own.
The result shipped internally first, proved itself across real engagements, and eventually launched as a standalone product.
It connects to your Git provider and issue tracker in under two minutes, loads three years of historical data automatically, and requires no sales call to start. It is SOC 2 Type II certified, has 20+ integrations, and starts at $15/month per contributor.
Features
- DORA Metrics benchmarked against 1,000+ engineering organizations
- PR Cycle Time split into five stages: Coding, Pickup, Review, Merge, and Deploy
- Engineering Allocation and Investment reporting
- AI Impact tracking for GitHub Copilot, Cursor, Claude Code, Amazon Q, Cody, and Windsurf
- Code Review analytics with reviewer workload distribution and PR size alerts
- Developer 360 profiles with activity heatmaps that flag burnout risk
- Sprint reporting with scope creep detection and planning accuracy scores
- Connects to 20+ tools across Git providers, issue trackers, incident management, and AI assistants
- SOC 2 Type II certified
Benefits
Visibility into where engineering time actually goes
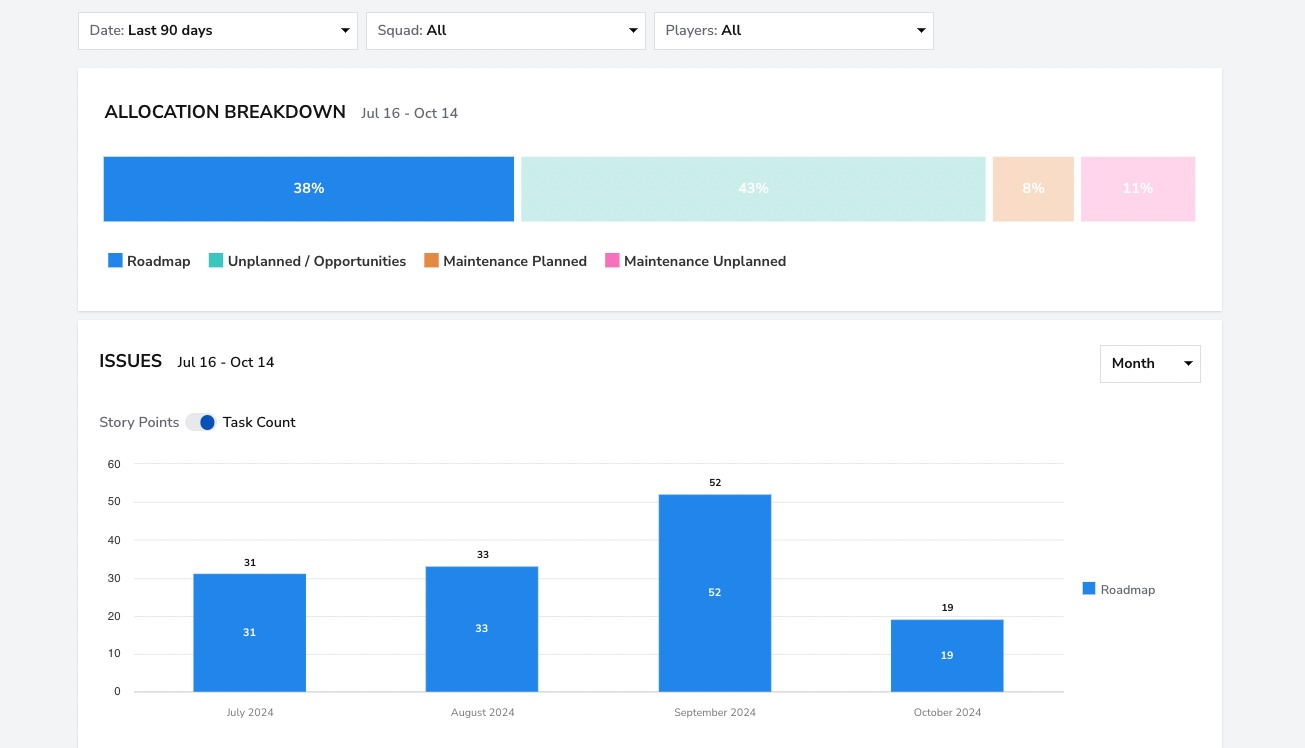
Boards and CEOs ask where engineering time goes. Without allocation data, that question has no good answer.
DevStats's Allocation dashboards break all engineering work into four categories: features, enhancements, maintenance (bugs, hotfixes, dependency updates), and productivity work like refactoring and tech debt.
The result is a clear picture of how the team's time is actually distributed, week over week. Teams that use allocation data to shift away from unplanned reactive work have recovered up to 75% more bandwidth for planned roadmap delivery.
A five-stage view of where delivery slows down
Aggregate cycle time tells you delivery is slow. It does not tell you which part of the process is responsible.
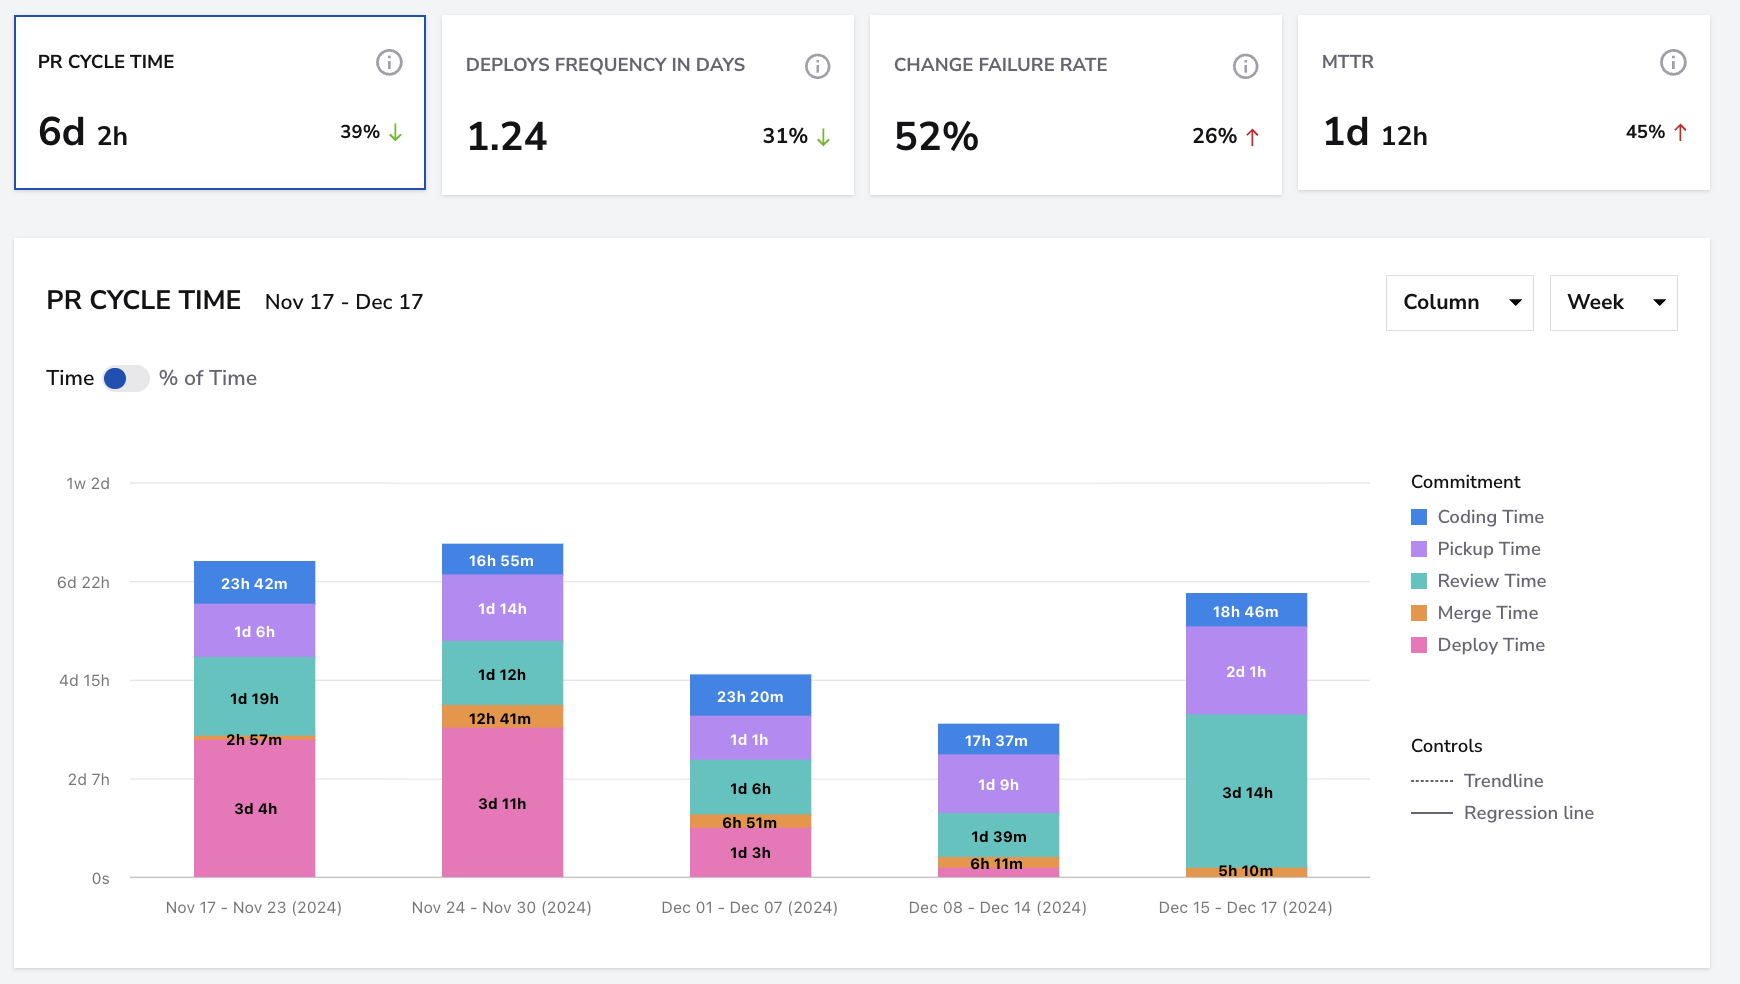
DevStats's PR Cycle Time report splits every pull request into five discrete stages: Coding, Pickup, Review, Merge, and Deploy. When PRs sit idle between being opened and picked up for review, that shows up immediately rather than getting buried in an average.
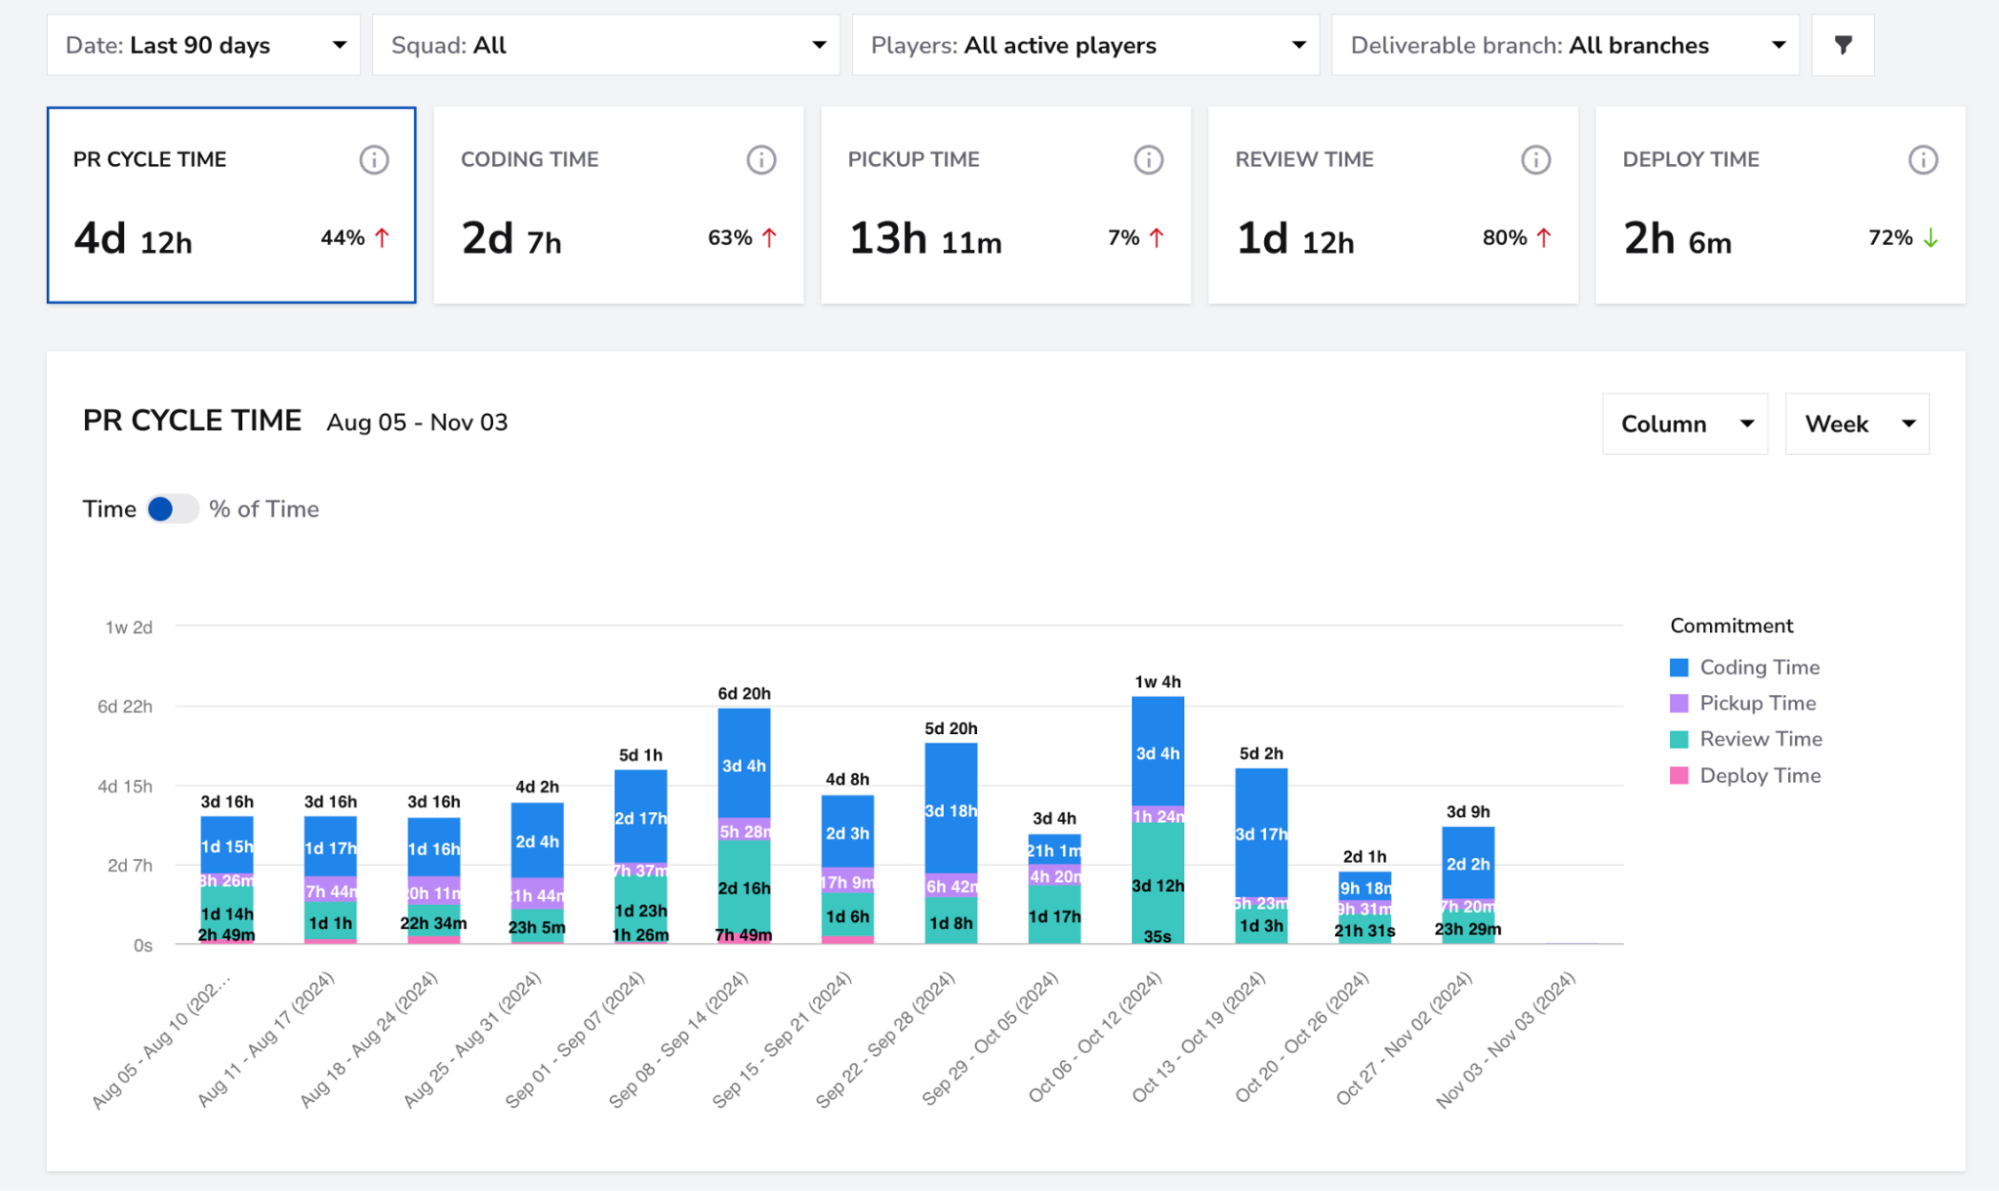
Engineering teams that act on this breakdown have cut cycle times by as much as 59%. Cycle time is often the single metric that predicts everything else about delivery health.
Quantified ROI on AI coding tools
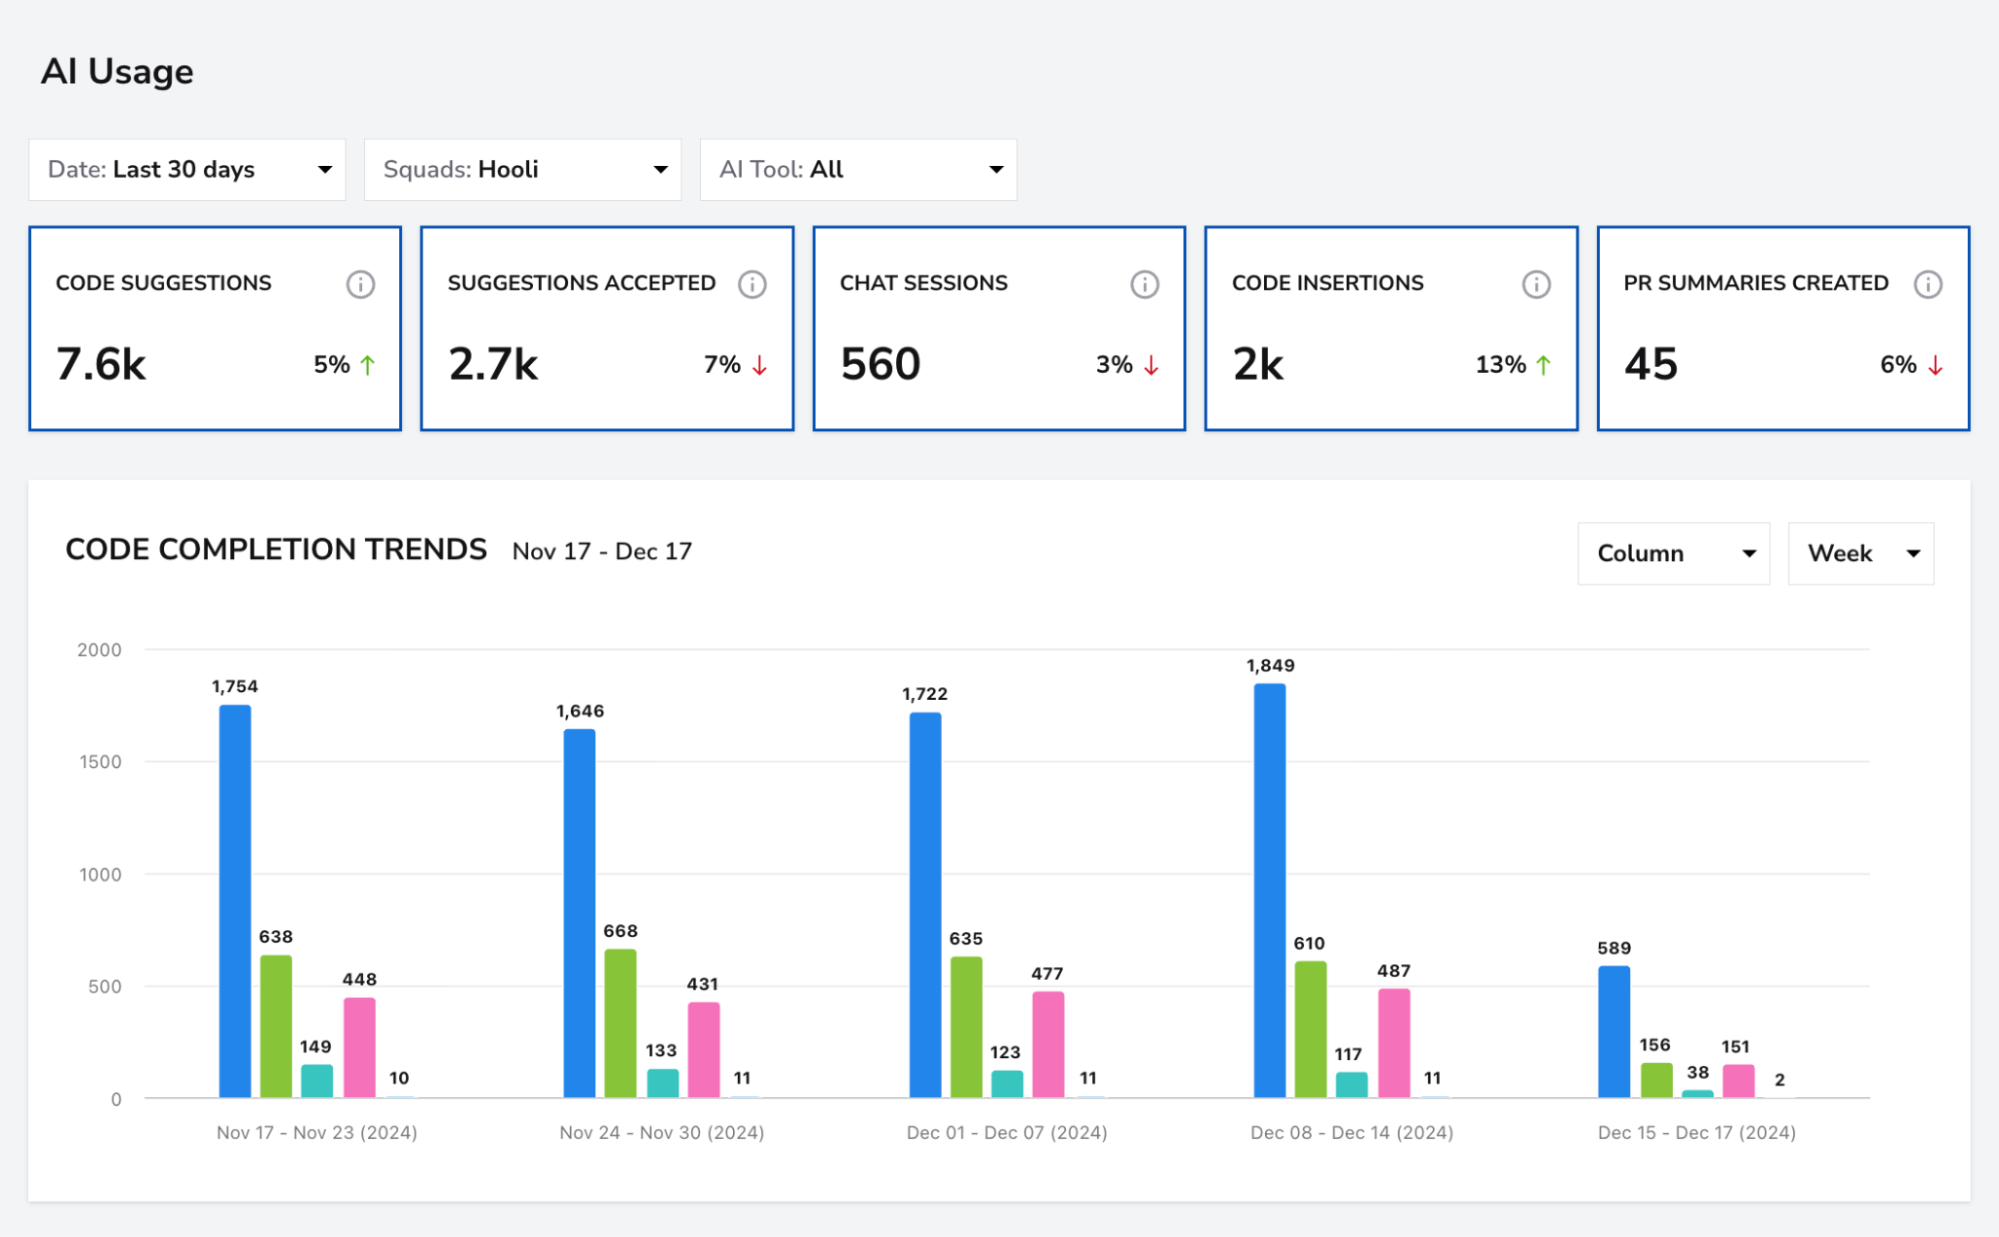
AI coding assistants are now a line item on most engineering budgets. Whether they are actually moving the needle is a different question.
DevStats's AI Impact report measures the before-and-after across Copilot, Cursor, Claude Code, and three other assistants: how PR volume shifts, whether velocity holds, what happens to review turnaround, and whether code quality stays intact.
On average, DevStats customers see a +24% velocity lift on PRs where developers used an AI coding assistant.
With scrutiny on AI-generated code quality increasing across the industry, that data gives engineering leaders something defensible to bring to the executive team.
Team-level measurement built on the SPACE framework
Engineering metrics platforms often raise an internal objection before they even get to a demo: developers worry about being watched.
DevStats is built on the SPACE framework, which measures team-level delivery health rather than individual output. There are no player rankings, no developer scorecards, no features designed to surface who is or is not pulling their weight.
The SPACE framework treats metrics as diagnostic inputs for engineering managers, not as performance reports on individuals. The activity heatmap surfaces early burnout signals: after-hours work patterns, uneven load distribution, before they turn into attrition.
DORA metrics with external benchmarks
Running DORA metrics internally gives you a trend. Comparing them against external data tells you whether that trend actually means anything.
DevStats's DORA Metrics dashboard scores your team against 1,000+ engineering teams and assigns an Elite, High, Medium, or Low tier automatically. That benchmark turns a number like "we deploy twice a week" into a meaningful signal rather than a guess.
For teams getting started with DORA for the first time, that external benchmark gives the numbers immediate meaning.
DevStats Pricing
- Starter at $15/month per contributor
- Pro at $27/month per contributor (billed annually), with a dedicated Slack channel for hands-on support
- Enterprise with custom pricing for larger organizations and tailored integrations
At $180/year per contributor on Starter, the math is simple: that is roughly what you pay a developer for two weeks. The platform pays for itself the first time it helps you find and fix a delivery bottleneck.
How to get started with DevStats
You can be looking at real data in five minutes. Point DevStats at your Git provider and issue tracker, and it backfills up to three years of history on its own. There is nothing to install, no code to change, and no onboarding project to schedule.
Teams can start a 14-day free trial, self-serve, no demo required, or can contact us and book a demo to walk through the dashboards against their actual stack first.
Alternative #2: LinearB
Best for: Mid-market engineering teams that want workflow automation built into their metrics platform and have budget flexibility above $29/dev/month.
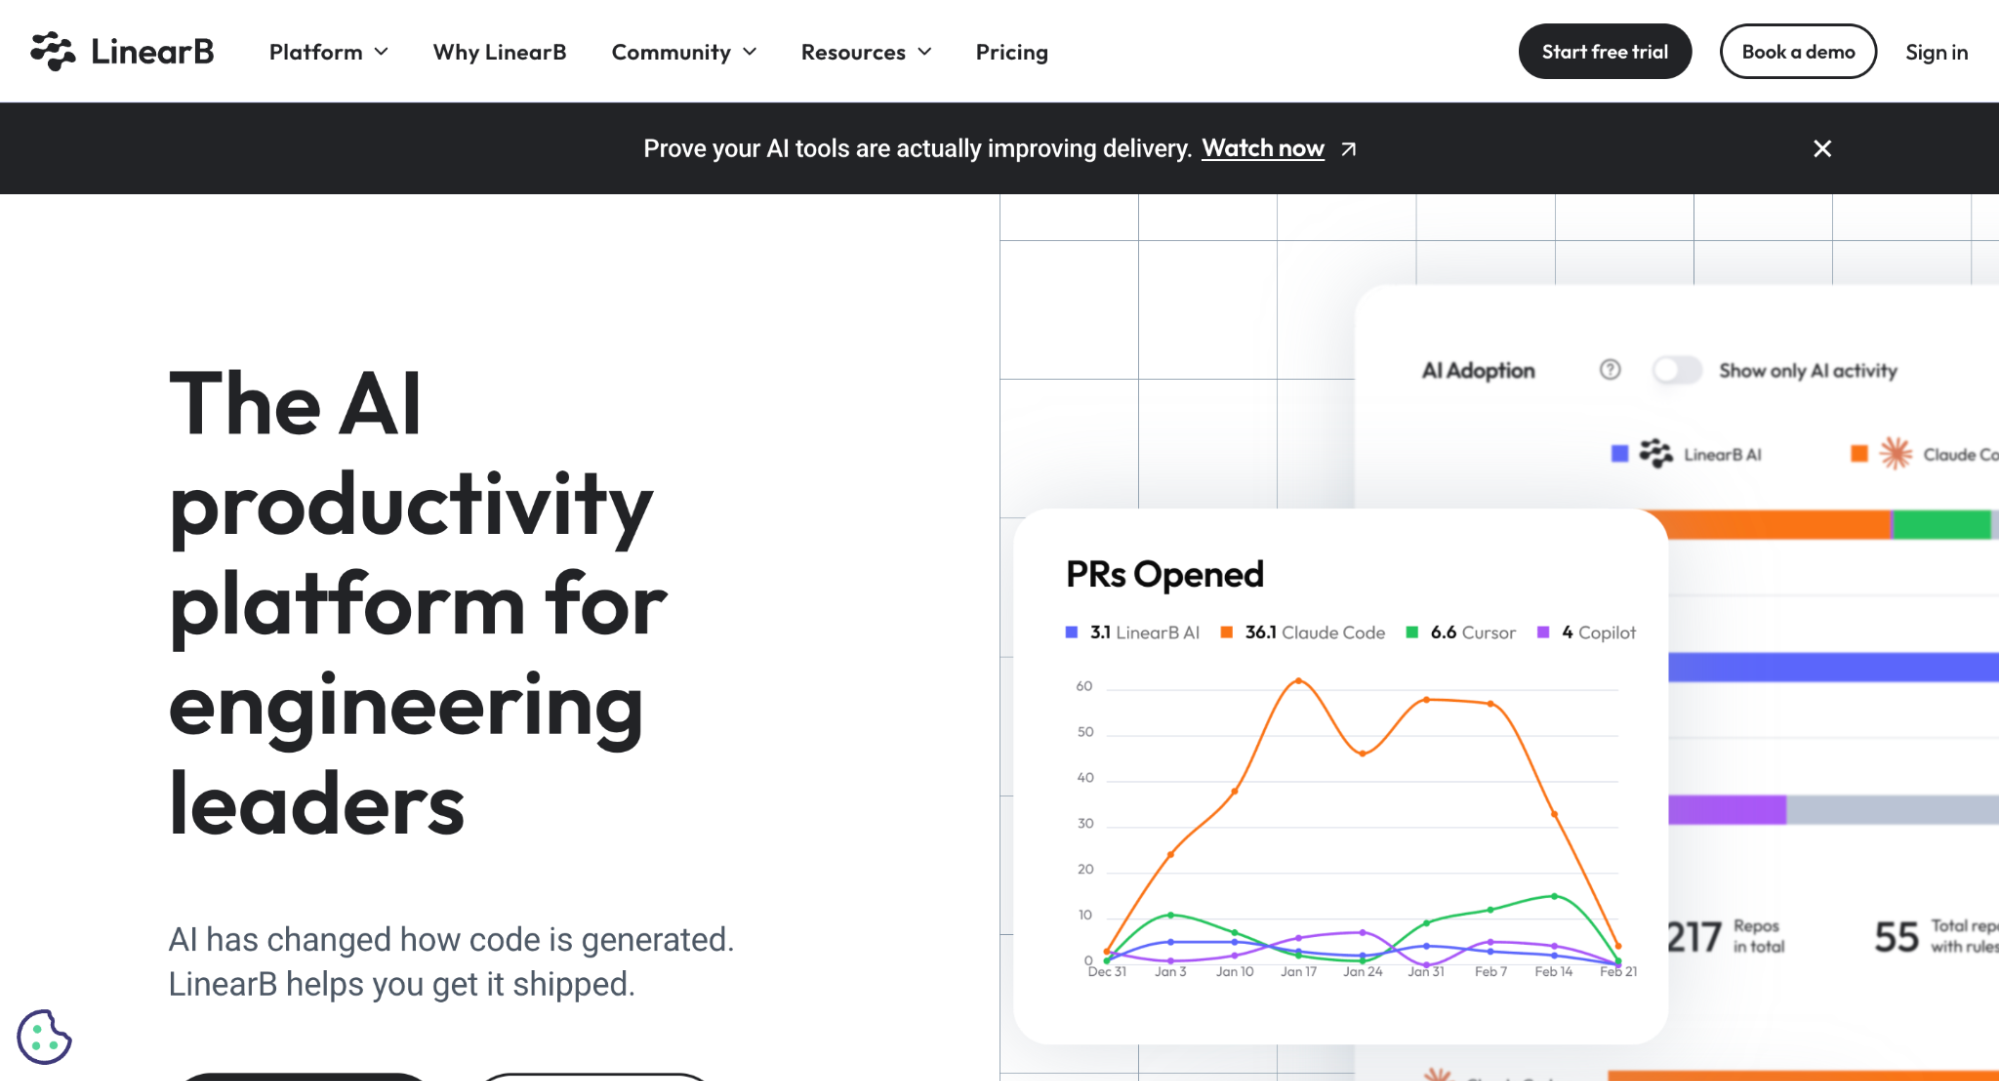
LinearB targets the same mid-market as DevStats. It covers delivery metrics, PR cycle time, and engineering efficiency, with workflow automation that lets engineering managers configure automated PR routing and notifications on top of metric data. The product is capable.
The tradeoff is price. LinearB's Essentials plan starts at $29/developer/month. Enterprise, which adds developer productivity insights, project forecasting, resource allocation, and R&D capitalization, runs $59/developer/month. A recent competitive deal saw LinearB close at $900K/year against a comparable DevStats bid of $300K/year for similar core features.
Features
- PR cycle time and delivery flow metrics
- DORA metrics tracking
- Workflow automation and automated PR routing (gitStream)
- Sprint and planning accuracy reports
- GitHub, GitLab, and Jira integrations
- Pricing from $29/dev/month (Essentials) to $59/dev/month (Enterprise)
Alternative #3: Swarmia
Best for: developer-first engineering teams, particularly in Europe, that want research-backed metrics and a clean interface, and where measuring individual AI tool ROI is not yet a priority.
Swarmia takes a developer-first approach to engineering intelligence. The platform is designed to feel useful to individual contributors, not just their managers, and the interface is one of the most polished in the category.
It covers DORA metrics, cycle time, and code review analytics, with built-in developer wellbeing signals and working agreements that let teams define their own norms for PR size and review speed.
Two things to weigh before evaluating: Swarmia's footprint in the US market is smaller than competitors like LinearB or DevStats, and it does not yet track AI coding tool ROI. If your team has deployed Copilot or Cursor and leadership wants impact data, that gap matters in 2026.
Features
- DORA metrics and cycle time tracking
- Code review analytics and team working agreements
- Built-in developer experience surveys
- Per-developer pricing
- GitHub, GitLab, and Jira integrations
- Pricing from $23/dev/month (single module) to $45/dev/month (Standard, all three modules), billed annually; free for teams of 9 or fewer; Enterprise custom
Alternative #4: DX (now Atlassian)
Best for: Large engineering organizations (100+ developers) already running Atlassian products that want to combine system metrics with developer survey data.
DX, acquired by Atlassian for approximately $1 billion, combines system data from Git and Jira with developer surveys to build a picture of productivity that includes how teams actually experience their work.
The DX Core 4 framework is research-backed and has real depth for organizations that want that level of measurement.
The Atlassian acquisition creates real uncertainty around roadmap direction and pricing. Teams choosing DX right now are betting on what Atlassian decides to prioritize.
Features
- DX Core 4 measurement framework combining survey and system data
- Developer Experience Index (DXI) benchmarking
- SDLC analytics and engineering allocation
- R&D capitalization reporting
- AI impact analysis
- Deep Atlassian product integrations
- Pricing is custom; contact sales for a quote
Alternative #5: Haystack
Best for: Small teams under 30 developers that want fast setup and basic DORA visibility without a complex configuration process.
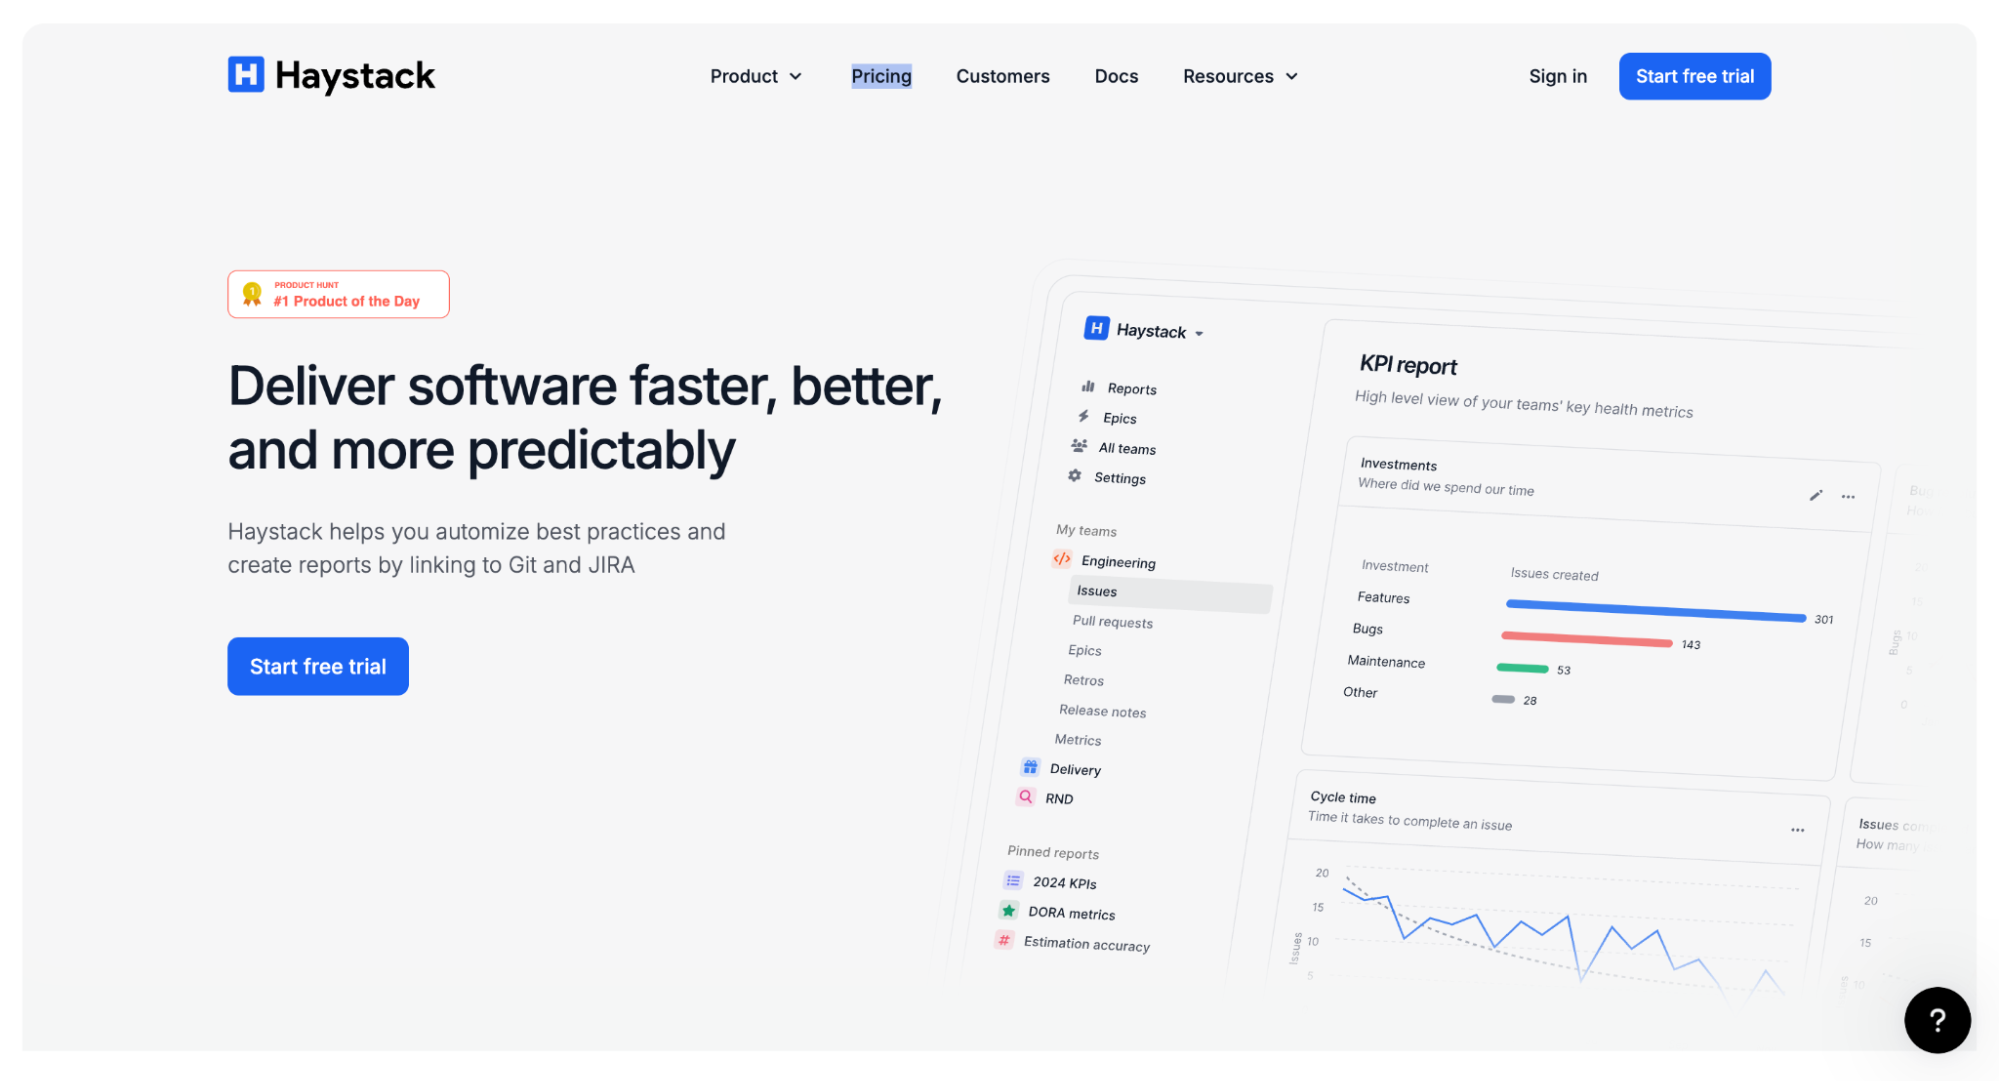
Haystack is the lightest tool in this category. Setup is fast, the interface is clean, and the focus is on surfacing real-time bottlenecks. Teams that need DORA metrics and cycle time visibility without heavy configuration find it useful as a starting point.
The depth is limited. Haystack shows aggregate numbers without the diagnostic granularity that drives action. There is no 5-stage PR breakdown, no engineering allocation reporting, and no AI tool ROI tracking.
Engineering managers who want to pinpoint where work stalls or measure Copilot's velocity impact will need something else.
Features
- DORA metrics tracking
- PR cycle time and throughput visibility
- Real-time Slack alerts for stuck PRs and burnout signals
- Developer activity dashboards
- GitHub integration focus
- Pricing from $20/member/month (Growth plan), billed annually; Enterprise custom
Alternative #6: Waydev
Best for: Teams in the early stages of evaluating engineering metrics tooling that want to validate a platform against their real data before committing.
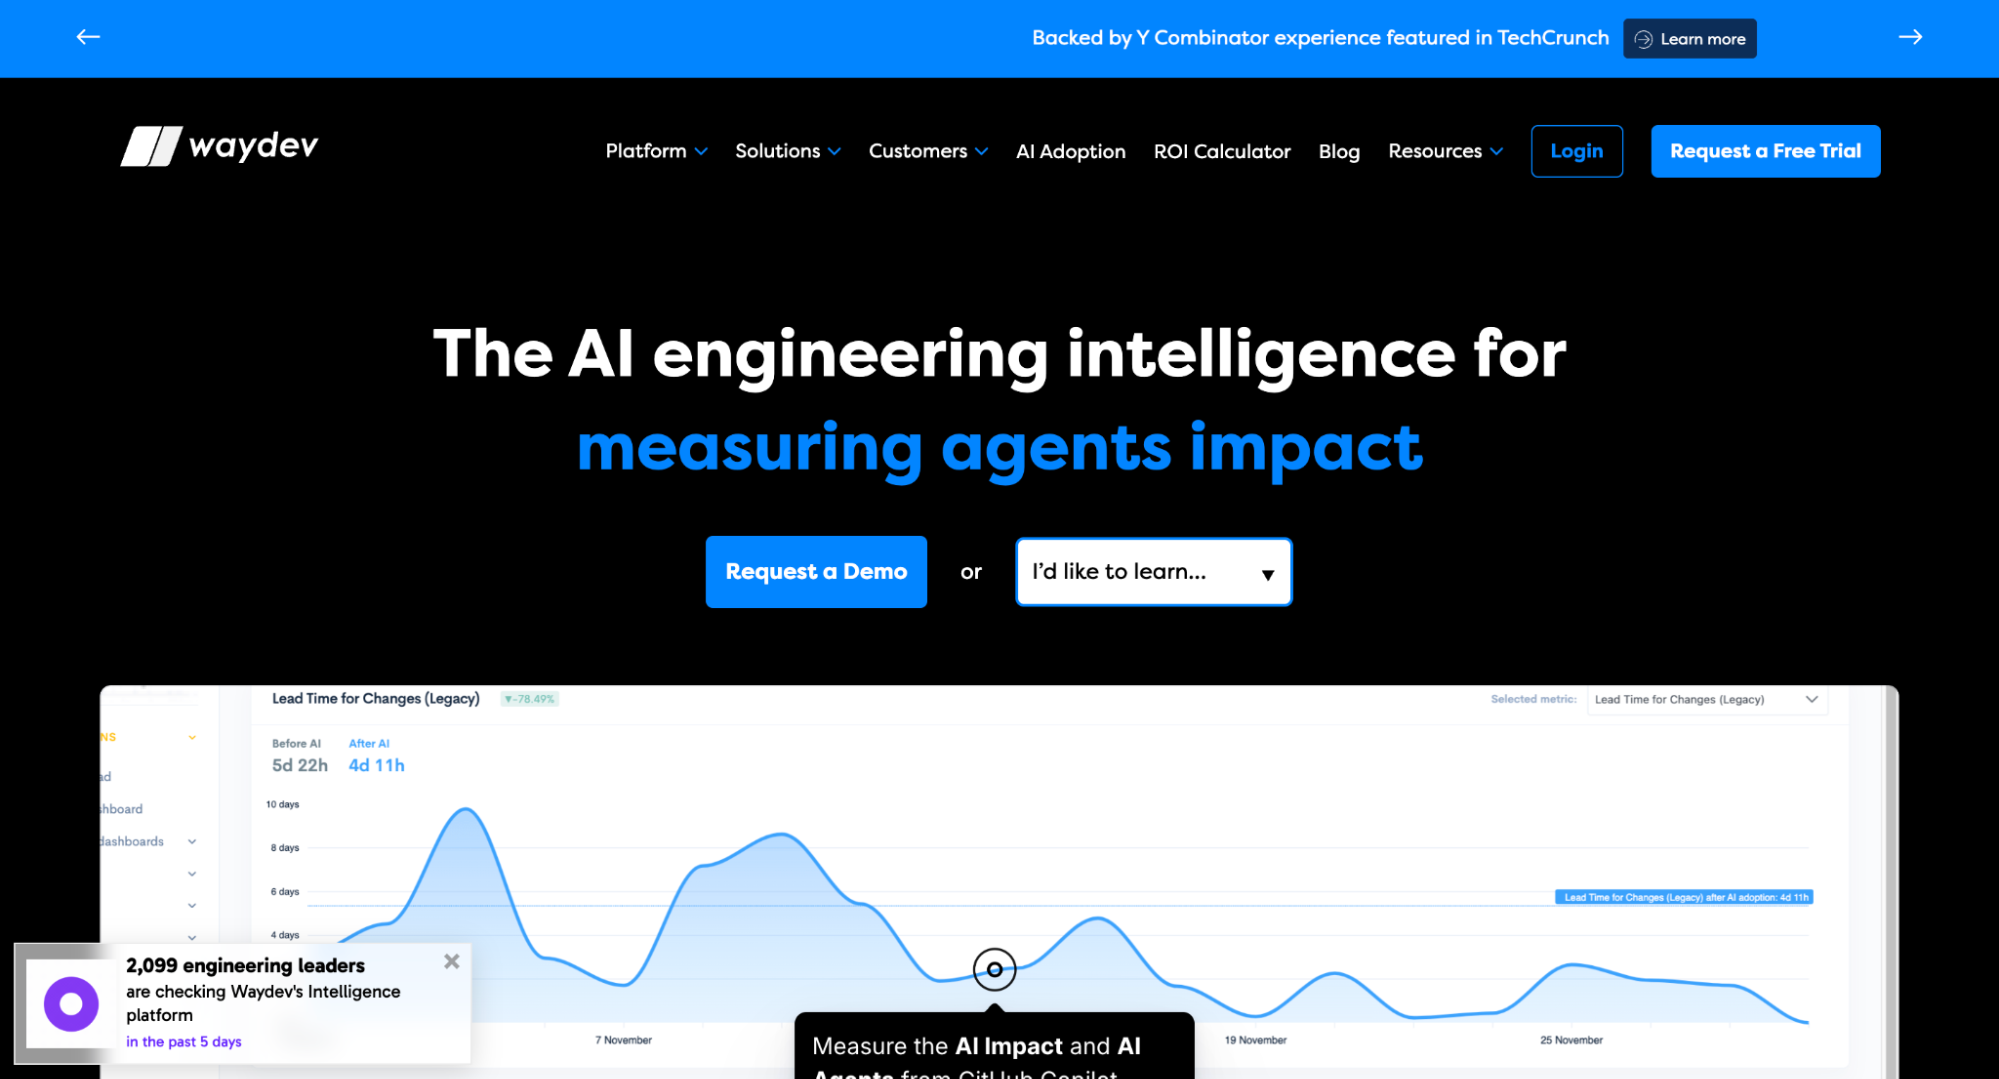
Waydev covers engineering performance reporting and delivery visibility across version control and issue tracking systems, with support for GitHub, GitLab, Bitbucket, Azure DevOps, Jira, and ClickUp. Its main differentiator is a proof-of-concept trial that lets teams validate the platform against their own data before signing a contract.
The product has not evolved as quickly as newer competitors. AI impact measurement and granular PR cycle time analysis are both missing, which narrows its usefulness for teams that need those capabilities now.
Features
- Engineering performance dashboards
- Git and issue tracker integrations
- Developer experience module
- AI-powered team insights
- POC trial before purchase
- Pricing from $29/contributor/month (Pro) to $54/contributor/month (Premium), billed annually; Enterprise custom
Alternative #7: Hatica
Best for: SMB engineering teams that need visibility across a wide set of tools at a mid-market price point, and where deep cycle time granularity is a lower priority.
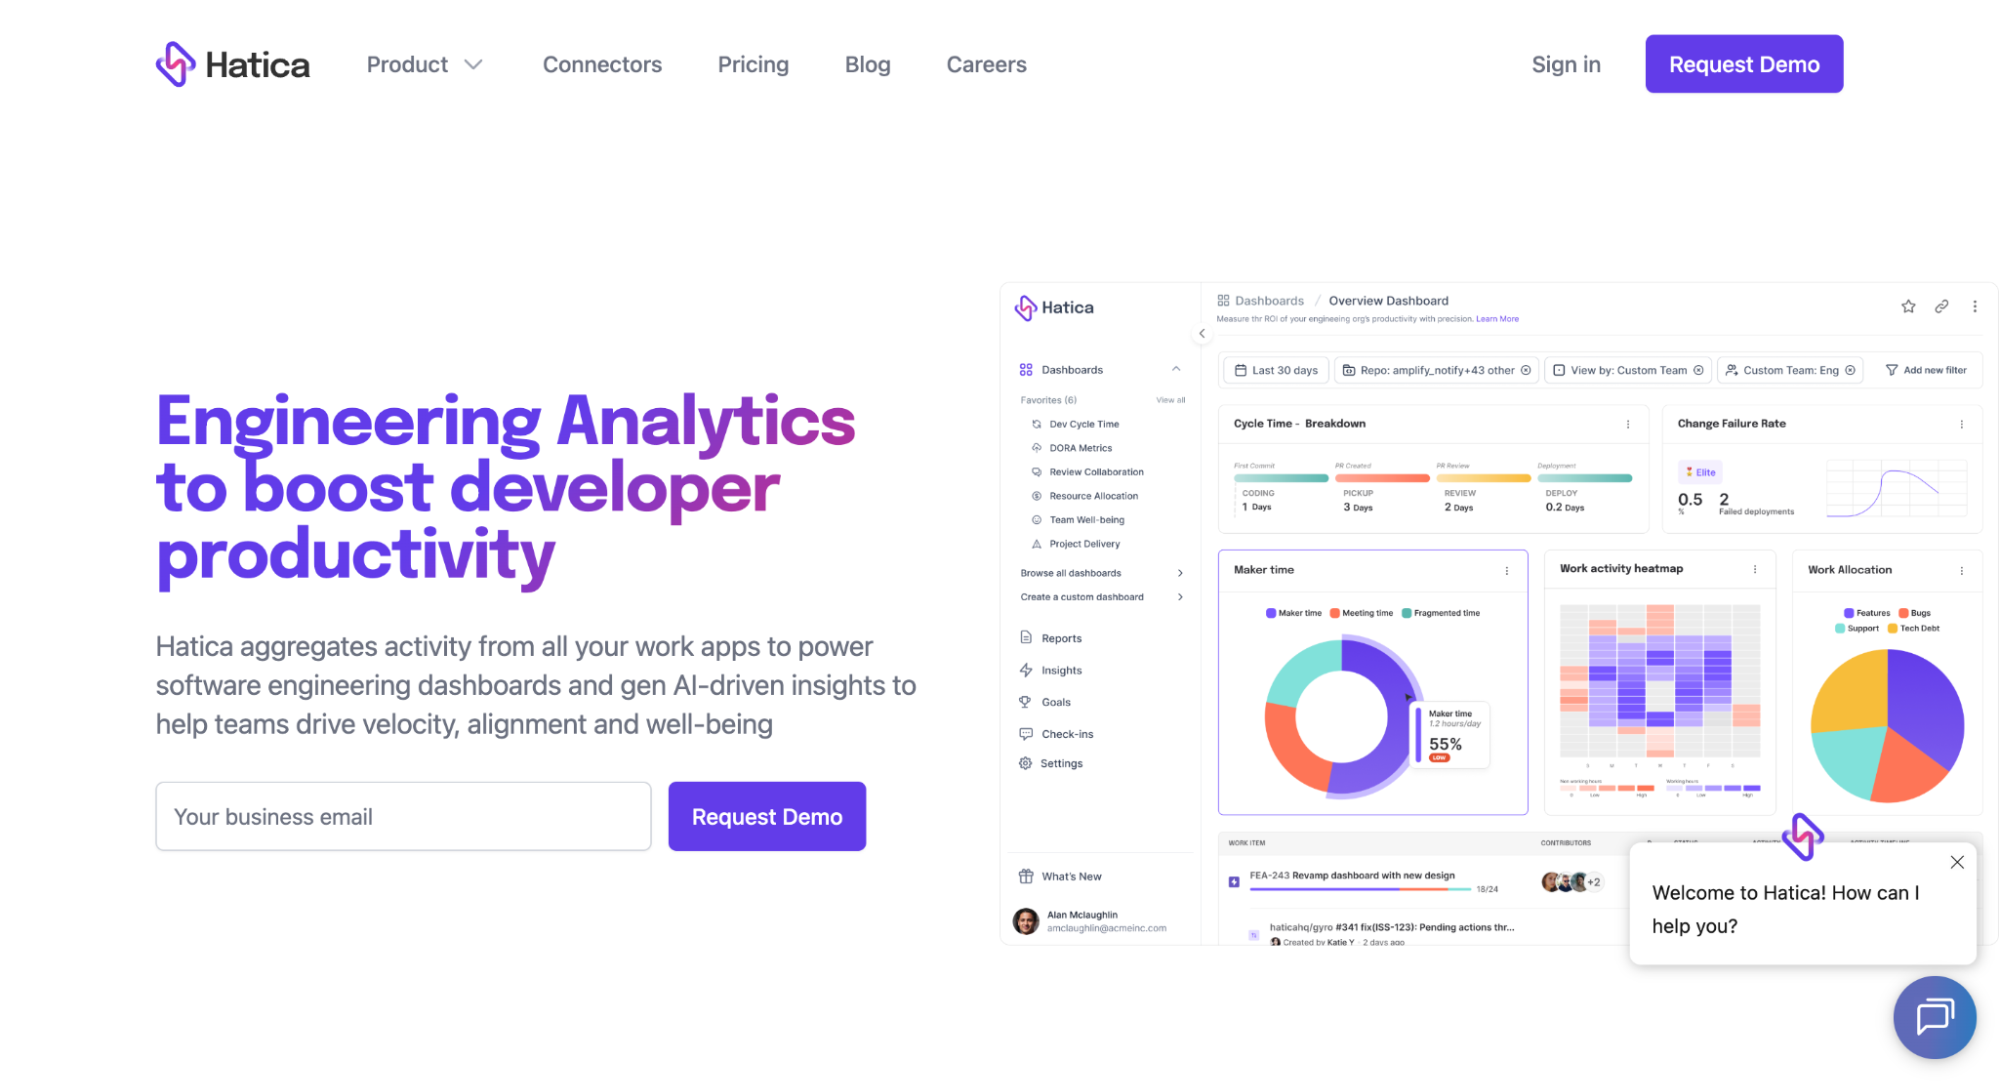
Hatica covers a similar price range to DevStats and offers a wide set of integrations. Teams that want to get data flowing from many tools quickly find it accessible.
The delivery insights are shallower, particularly on cycle time granularity and code review analysis. If your goal is to pinpoint exactly where reviews bottleneck and why, Hatica's reporting does not go deep enough to drive specific process changes.
Features
- Engineering metrics dashboards
- DORA metrics
- Developer wellbeing tracking
- Broad tool integration coverage
- Team reporting
- Free tier available; Pro at $19/member/month; Business at $29/member/month; Enterprise custom
Alternative #8: Pluralsight Flow
Best for: Engineering teams already locked into a Pluralsight subscription who want to extract some engineering metrics value from an existing contract.
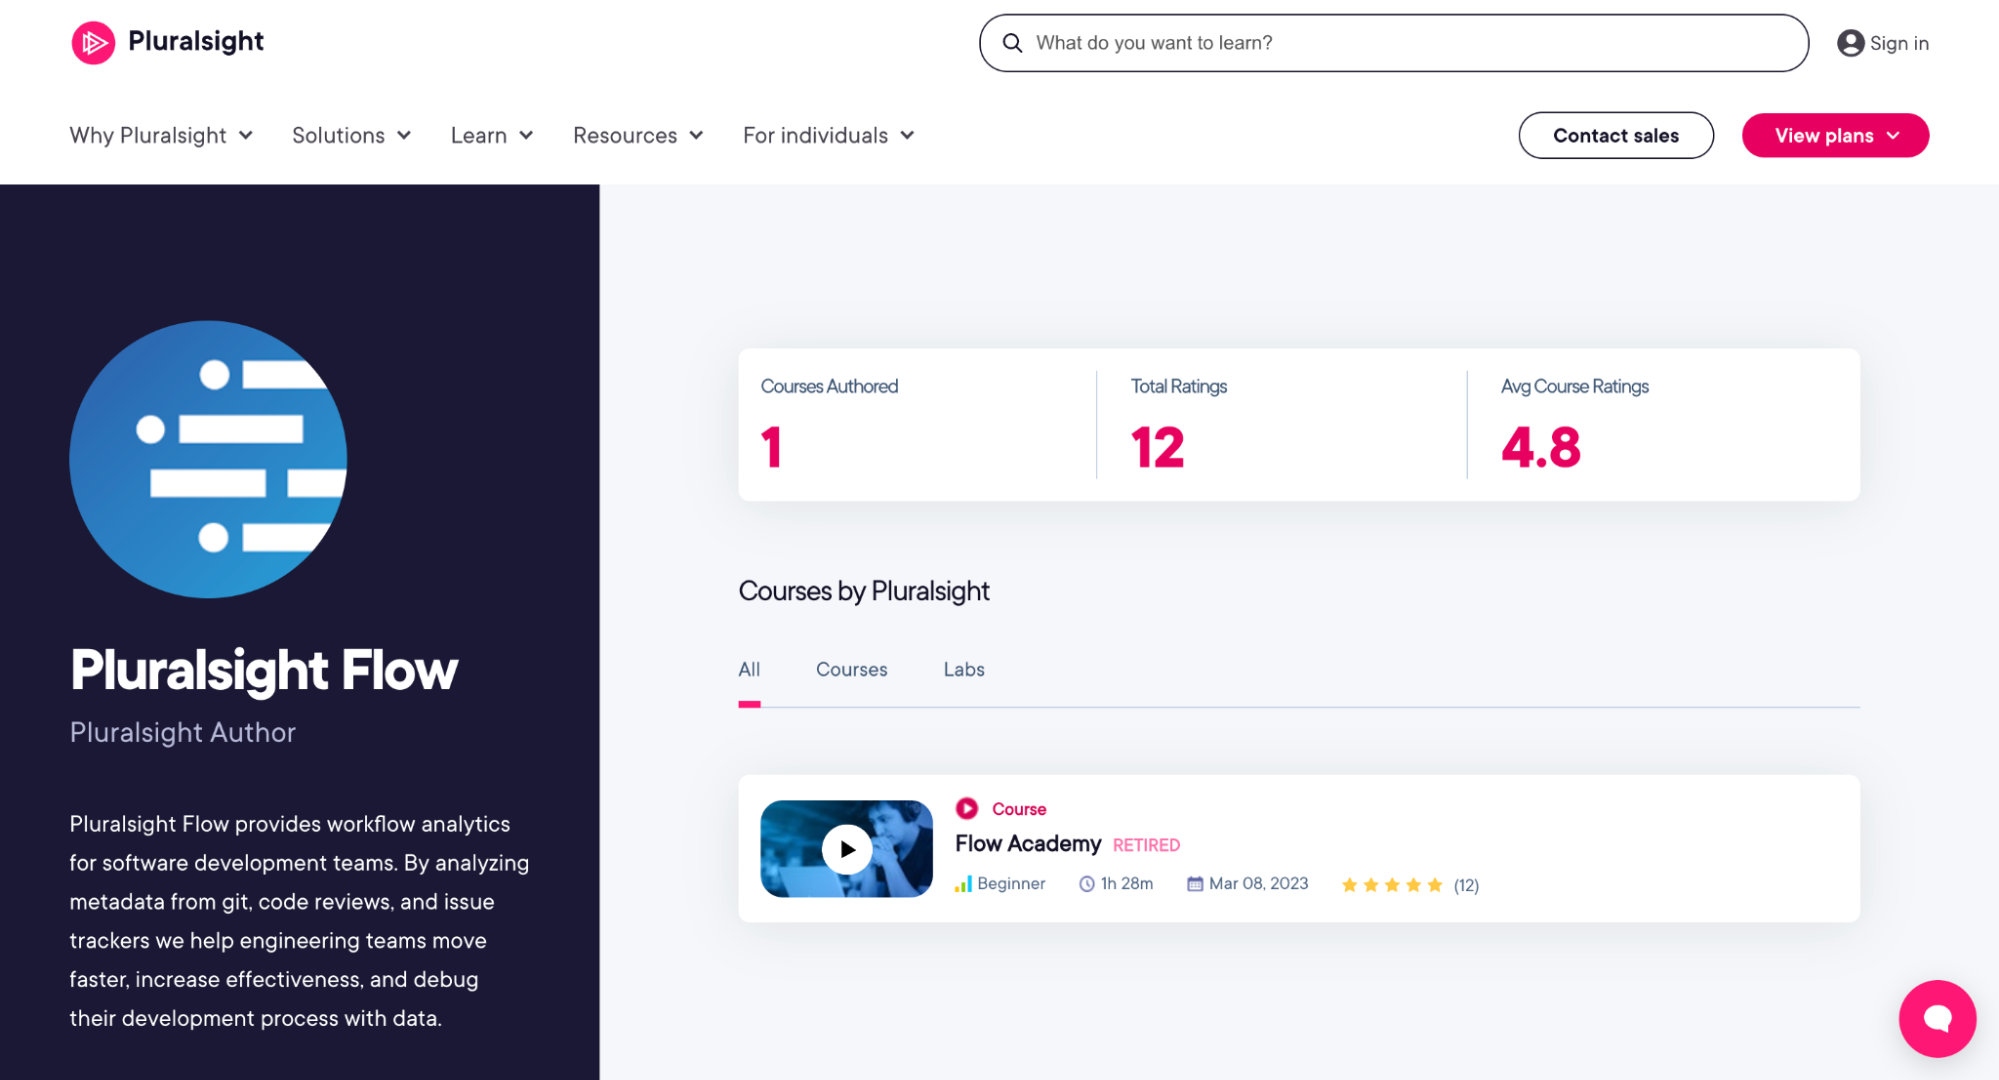
Pluralsight Flow has been through three ownership changes. The interface has not been modernized, configuration requires more effort than current alternatives, and meaningful product updates have stalled. It covers Git-based metrics and basic DORA tracking, but the depth and usability gap compared to newer tools is significant.
If your organization already holds a Pluralsight learning subscription, Flow comes bundled. Outside of that scenario, there are stronger options at every price tier.
Features
- Git-based engineering metrics
- DORA metrics tracking
- Code review analytics
- Bundled with Pluralsight's learning platform
- Pricing included with a Pluralsight subscription; contact sales for current rates
What is the best Jellyfish alternative?
| DevStats | LinearB | Swarmia | DX (Atlassian) | Haystack | Jellyfish | |
|---|---|---|---|---|---|---|
| Pricing | From $15/dev/month | From $29/dev/month | From $23/dev/month | Custom | From $20/dev/month | $100K+/year |
| Setup time | Under 2 minutes | Hours to days | Hours | Days | Hours | Weeks to months |
| DORA metrics | Yes, benchmarked | Yes | Yes | Yes | Yes | Yes |
| 5-stage PR breakdown | Yes | No | No | No | No | No |
| AI tool ROI tracking | Yes, 6 tools | Partial | No | Yes | No | Yes |
| Engineering allocation | Yes | Yes | Partial | Partial | No | Yes |
| Developer surveys | No | No | Yes | Yes | No | No |
| R&D capitalization | No | No | No | Yes | No | Yes |
| SOC 2 Type II | Yes | Yes | Yes | Yes | No | Yes |
| VC-funded | No | Yes | Yes | Acquired | Yes | Yes |
| Free trial | Yes, 14 days | Yes | Yes | Demo only | Yes | Demo only |
| Ideal team size | 15+ | 50-200 devs | 20-100 devs | 100+ devs | 10-30 devs | 200+ devs |
How to choose the right platform for your team
Here are a few questions that help you tell the right tool from the wrong one.
What is your team size?
The 15+ developer range is where DevStats, LinearB, and Swarmia compete most directly. Below 30 developers, Haystack covers the basics at lower cost and complexity.
Once you cross 200 developers, the R&D capitalization and board-level financial reporting that Jellyfish and DX offer become harder to replicate with mid-market tools.
Do you need R&D cost capitalization?
If your finance team or board needs engineering time mapped to balance sheet categories, Jellyfish or DX are the only real options.
Capitalization reporting is not a feature mid-market tools have built yet. It is mainly relevant to publicly traded companies or those approaching an IPO.
How urgent is AI coding tool ROI?
If Copilot or Cursor is already deployed and your executive team is asking whether the spend is justified, the field narrows fast. DevStats measures ROI across six AI assistants. Jellyfish covers it at enterprise scale. LinearB has partial tracking. Swarmia and Haystack have not built this yet.
Is developer experience measurement a priority?
If you want survey data alongside system metrics, DX and Swarmia are the strongest picks. Both have survey tooling built into the product. Delivery-focused platforms like DevStats and LinearB measure developer experience through behavioral signals (activity patterns, after-hours work, load distribution) rather than self-reported data.
How long can you wait to see data?
If the timeline is "this week," Jellyfish and DX are off the table. Both require multi-week rollouts. DevStats connects in under two minutes. Haystack and Swarmia are also quick. LinearB takes longer depending on how many integrations you configure.
The best thing you can do before scheduling demos is get clear on which metrics will actually change how your team makes delivery decisions.
Getting started with DevStats
If you are evaluating options after this guide, DevStats is worth putting first on your list. Connect your Git provider and issue tracker, and the platform pulls up to three years of historical data automatically. There is nothing to configure before you see real numbers from your own team.
Pricing starts at $15/month per contributor on the Starter plan. The Pro plan at $27/month adds a dedicated Slack channel for direct support. Enterprise pricing is available for custom integration needs.
A 14-day free trial is available with no credit card. If you would rather see the dashboards with someone from the DevStats team before committing, contact us and book a walkthrough.
Frequently asked questions
What are the main reasons engineering teams look for Jellyfish alternatives?
Pricing, complexity, and fit. Jellyfish's contracts start at $100K+ per year with multi-year commitments, which prices out Series A and Series B companies before the conversation starts.
The platform is also oriented toward executive and finance reporting. Engineering managers and dev leads, the people closest to delivery problems, often find the day-to-day views too shallow to drive action.
Does DevStats sit on top of Jira or Linear?
DevStats layers on top of your existing project management tools. It connects to Jira, Linear, and ClickUp and pulls data from those systems to surface delivery insights that are invisible inside the tools themselves: sprint progress, cycle time, carryover rates.
Your team keeps using their existing tools exactly as they do today.
How long does it take to migrate from Jellyfish to DevStats?
DevStats connects directly to your source tools (GitHub, Jira, etc.), which already contain your historical data. It loads up to three years of history automatically. There is no export process, no field mapping, and no migration project to manage. Most teams are looking at live data within the same day they connect.
Is DevStats suitable for teams concerned about developer surveillance?
DevStats measures delivery patterns at the team level using the SPACE framework. There are no individual rankings, no head-to-head comparisons between developers, and no features built around surfacing who is or is not performing. Engineering managers use the data to spot process problems, test fixes, and track whether those fixes hold.