
Most engineering dashboards measure everything but inform nothing. They fill up with numbers because tools can produce them, not because anyone will act on them. Consequently, leaders end up no closer to knowing whether delivery is healthy or if the team is nearing burnout.
A useful metric set is smaller than you think and chosen with intent. The question is never "what can we measure?"; it is "what decision does this number change?" Most metrics on a typical dashboard fail that test.
This guide covers the metrics worth tracking as a leader. These are grouped by what each helps you understand, including notes on what to do when a metric shifts and a hard line on the measurements that quietly damage a team.
Engineering metrics: key takeaways
- A metric earns its place only if someone will act on it. The set worth tracking is small and organized by purpose: delivery, quality, flow, allocation, and team health.
- Certain metrics help a team improve day to day while others provide leaders with cross-team visibility; forcing a team to optimize a reporting metric breeds gaming.
- Quality signals are risk indicators that tell you where to invest in testing or refactoring, never scoreboards for ranking teams or people.
- The fastest way to ruin a metric is to evaluate individuals with it, so everything here belongs at the team and process level.
- See every metric that matters in one place. Start a free trial and connect your existing tools in under two minutes, no code changes required.
What makes an engineering metric worth tracking?
A metric earns its place only if someone will act on it. The useful question is not what you can measure, since modern tools can measure almost anything, but what decision a given number will inform once it moves.
Good engineering metrics fall into a few purposes: delivery, flow, quality, allocation, and team health. Each answers a different leadership question, from "are we shipping well" to "will people stay," and a balanced set picks a few from each rather than piling ten into one category. The broader field of software development metrics shows how these categories relate.
Read every metric as a diagnostic instrument rather than a scoreboard. A number that has gone the wrong way is an invitation to ask why, and the answer almost always lives in the system rather than in any one person.
Metrics for teams vs metrics about teams
Certain metrics help a team improve day to day, whereas others provide leaders with cross-team visibility. Conflating the two causes most of the damage. For instance, a team uses cycle time to find its own bottleneck; a VP uses it to see which squads need support. It is the same metric, but with a different purpose.
The trap is forcing a team to optimize a metric meant for org-level reporting, which breeds gaming as surely as hiding org metrics breaks trust. When a reporting number becomes a target, people move the number instead of improving the work, and the signal you were relying on quietly stops being true.
The fix is transparency about which metric serves which purpose. Tell the team plainly that cycle time is theirs to improve and allocation is what you report upward, and the gaming incentive mostly disappears.
Software delivery metrics: are we shipping well?
The DORA set is the clearest read on delivery health, because it covers speed and stability together rather than letting one hide the other. These four are the foundation most leaders should anchor on. For the full picture, see what the DORA metrics are in detail.
Deployment frequency and lead time for changes
Deployment frequency refers to how often you ship, and lead time for changes is the duration work takes to reach production. When read together, they reveal delivery speed and batch size; a team that ships rarely is usually a team shipping large, risky changes.
What to do: if either degrades across teams, look for manual release steps, slow reviews, or oversized batches rather than asking people to hurry. The fix is almost always in the pipeline.
Change failure rate and recovery time
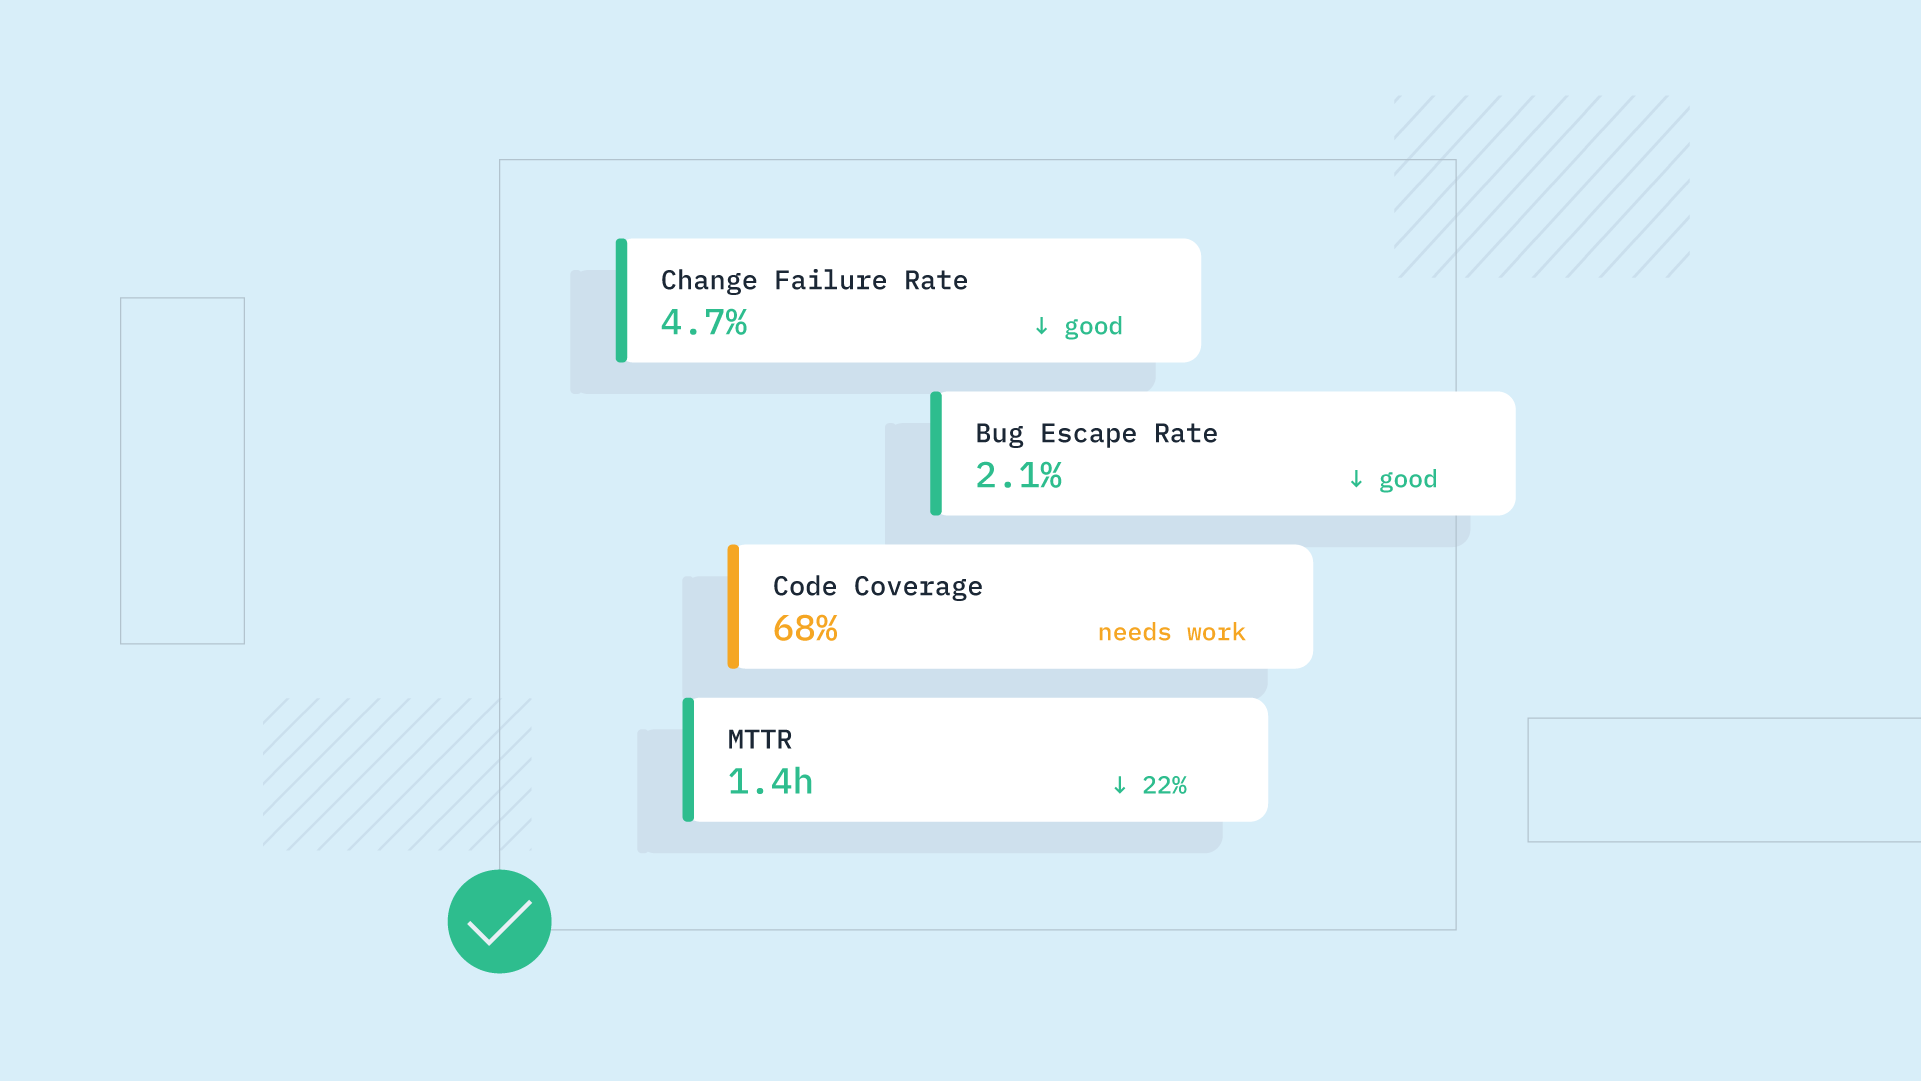
The change failure rate represents the percentage of deployments that require urgent intervention, and recovery time measures how quickly you restore service. These metrics provide the stability half of delivery health, keeping speed honest by exposing whether faster shipping is causing more frequent breaks.
What to do: rising failure rates usually respond to better automated testing and smaller batches, not to slowing everything down. Speed and stability move together on healthy teams, so a trade-off between them is a signal something deeper is wrong.
Software quality metrics: is the codebase healthy?
Quality signals are indicators of risk, not performance targets. They tell you where the codebase is fragile so you can decide where to invest, and the moment they become scores, teams optimize the number instead of the health it was meant to represent.
Defect and escaped-defect rate
Escaped-defect rate refers to the number of defects that reach production compared to those caught earlier during review or testing. A rising rate points to gaps in testing or review coverage; it is a quality outcome rather than a mere activity count, which makes it essential to watch.
What to do: pair it with change failure rate to confirm quality is genuinely slipping before you act, since one noisy month is not a trend. Two signals moving together is a much stronger basis for a decision than either alone.
Code coverage and churn as risk signals
Read code coverage as a trend in high-risk areas rather than a target number, because a blanket coverage mandate just produces low-value tests. Read churn, how often the same code keeps getting rewritten, as a map of where the codebase is unstable. Declining coverage alongside rising churn means risk is accumulating in a specific place.
What to do: use both to ask better questions about fragile systems, not to mandate "write more tests" or "churn less." The numbers point you at the risky module; a human decides whether it needs a refactor, more tests, or a redesign.
Flow metrics: where does work get stuck?
Flow metrics expose the friction between starting work and shipping it, and cycle time broken into stages is the single most useful view. An aggregate number tells you work is slow; the staged version tells you where, which is the only thing you can act on.
The signals worth watching are cycle time by stage, time to first review, batch size, and CI feedback speed. A widening review wait or a climbing batch size is usually where the delay concentrates, and a staged view of PR cycle time makes it visible. Review friction in particular is common enough to deserve its own discipline, starting with how to do a great code review.
What to do: use stage-level data to find the one bottleneck worth fixing rather than pushing every number at once. Most flow problems concentrate in a single stage, and fixing that one returns more than a dozen small optimizations elsewhere.
Allocation metrics: where does engineering time go?
Leaders consistently misjudge where engineering effort actually goes until they measure it. The instinct is that most time goes to new features; the reality is often that keeping the lights on and unplanned work have quietly taken half the quarter.
Investment balance splits effort across new work, improvements, keeping the lights on, and productivity work, and planning accuracy shows how much committed work actually ships. Together they turn "where did the quarter go" from a guess into a number.
What to do: use allocation data as a conversation starter with the business about capacity and tradeoffs, never as a team target. It works best in a roadmap discussion, where showing that maintenance ate 40% of capacity reframes what is realistic to promise.
Team health metrics: will people stay?
System metrics show what is happening; surveys show why, and whether people actually want to stay. A dashboard can tell you cycle time rose, but only the team can tell you it rose because the on-call rotation is grinding them down.
Developer experience survey data surfaces what dashboards miss: friction, frustration, unclear priorities, and the early signals of developer burnout that show up in sentiment long before they show up in resignations.
What to do: ask specific, actionable survey questions and close the loop so feedback visibly drives change. A survey that never produces a visible response teaches people to stop answering honestly, which is worse than not asking.
How to measure engineering team performance without harming the team
The most common failure in measuring engineering team performance is using metrics to evaluate individuals, which measures the wrong thing and invites gaming. Productivity is a property of a system, and pinning it on a person both misreads the cause and teaches everyone to optimize their personal number at the team's expense.
The guardrails are simple to state and worth holding firmly:
- Measure at the team level. Aggregate every metric to the squad or team, since that is the unit that actually owns the workflow.
- Separate "for" and "about" metrics. Be explicit about which metrics a team improves and which you report upward, so nobody games a reporting number.
- Use trends, not snapshots. A single sprint is noise; the direction over a quarter is signal.
- Ask "what can we learn," not "whose fault is this." The framing decides whether metrics build trust or destroy it.
Hold these and metrics become a shared tool. Drop them and the same numbers become surveillance, and the data degrades the moment people realize they are being ranked.
Where to start: pick one problem
Do not instrument everything at once. Pick one felt problem, the review queue that is always backed up, the sprints that never finish, and measure that one thing well before adding anything else.
Then run the loop: measure the problem, make a change, check whether the improvement stuck, and only then decide whether the metric becomes a permanent KPI or a periodic diagnostic you revisit each quarter. Most metrics should be diagnostics you check occasionally, not dials you stare at daily.
The goal is a habit, not a dashboard for its own sake. A leader who fixes one measured problem a quarter builds more trust in data than one who ships a fifty-metric dashboard nobody opens.
Tracking the metrics that matter with DevStats
Pulling delivery, flow, quality, allocation, and survey data from every team by hand is the kind of job that never gets finished. DevStats is an engineering intelligence platform that surfaces all five purposes from the tools you already use, with benchmarks so a number has a reference point, and a code review report for the flow and quality signals.
The framing stays diagnostic. DevStats shows you the picture across all five categories, like quality slipping in one service while another squad carries every review. You decide where to act, with allocation data ready when the roadmap conversation comes. For a deeper view of how benchmarks fit in, see our guide to engineering performance metrics. Everything is measured at the process level, never as individual rankings, because the point is improving the system rather than scoring the people in it.
See every metric that matters in one place
A scattered set of dashboards is how good metrics go unread.
Connect your existing tools and DevStats shows your delivery, quality, and team-health metrics in one place with benchmarks, set up in under 2 minutes with no code changes.
Start a free trial and put the metrics that matter in one view.
Frequently asked questions
What are the most important engineering metrics for leaders?
The most useful set is small and grouped by purpose: delivery (deployment frequency, lead time, change failure rate, recovery time), flow (cycle time by stage), quality (escaped-defect rate, coverage, churn), allocation (investment balance, planning accuracy), and team health (developer experience surveys). Pick a few from each rather than tracking everything. The test for any metric is whether its movement would change a decision.
What are software quality metrics?
Software quality metrics are signals that indicate the risk and health of a codebase, such as escaped-defect rate, change failure rate, code coverage trends, and code churn. They are best read as indicators of where to invest in testing or refactoring, not as performance targets. Used as scoreboards, they get gamed and stop reflecting real quality.
How do you measure engineering team performance?
Measure at the team and process level using trends rather than snapshots, and group metrics by purpose so each one informs a specific decision. Separate the metrics a team uses to improve from the ones you report upward, and never use either to rank individuals. The goal is to learn where the system needs attention, not to assign blame.
Should you measure individual developer performance?
No, individual performance metrics measure the wrong thing and invite gaming, since productivity is a property of the system rather than the person. Metrics like cycle time and throughput belong at the team level, where they describe a workflow you can improve together. Use them to ask what the team can learn, not whose fault a number is.