
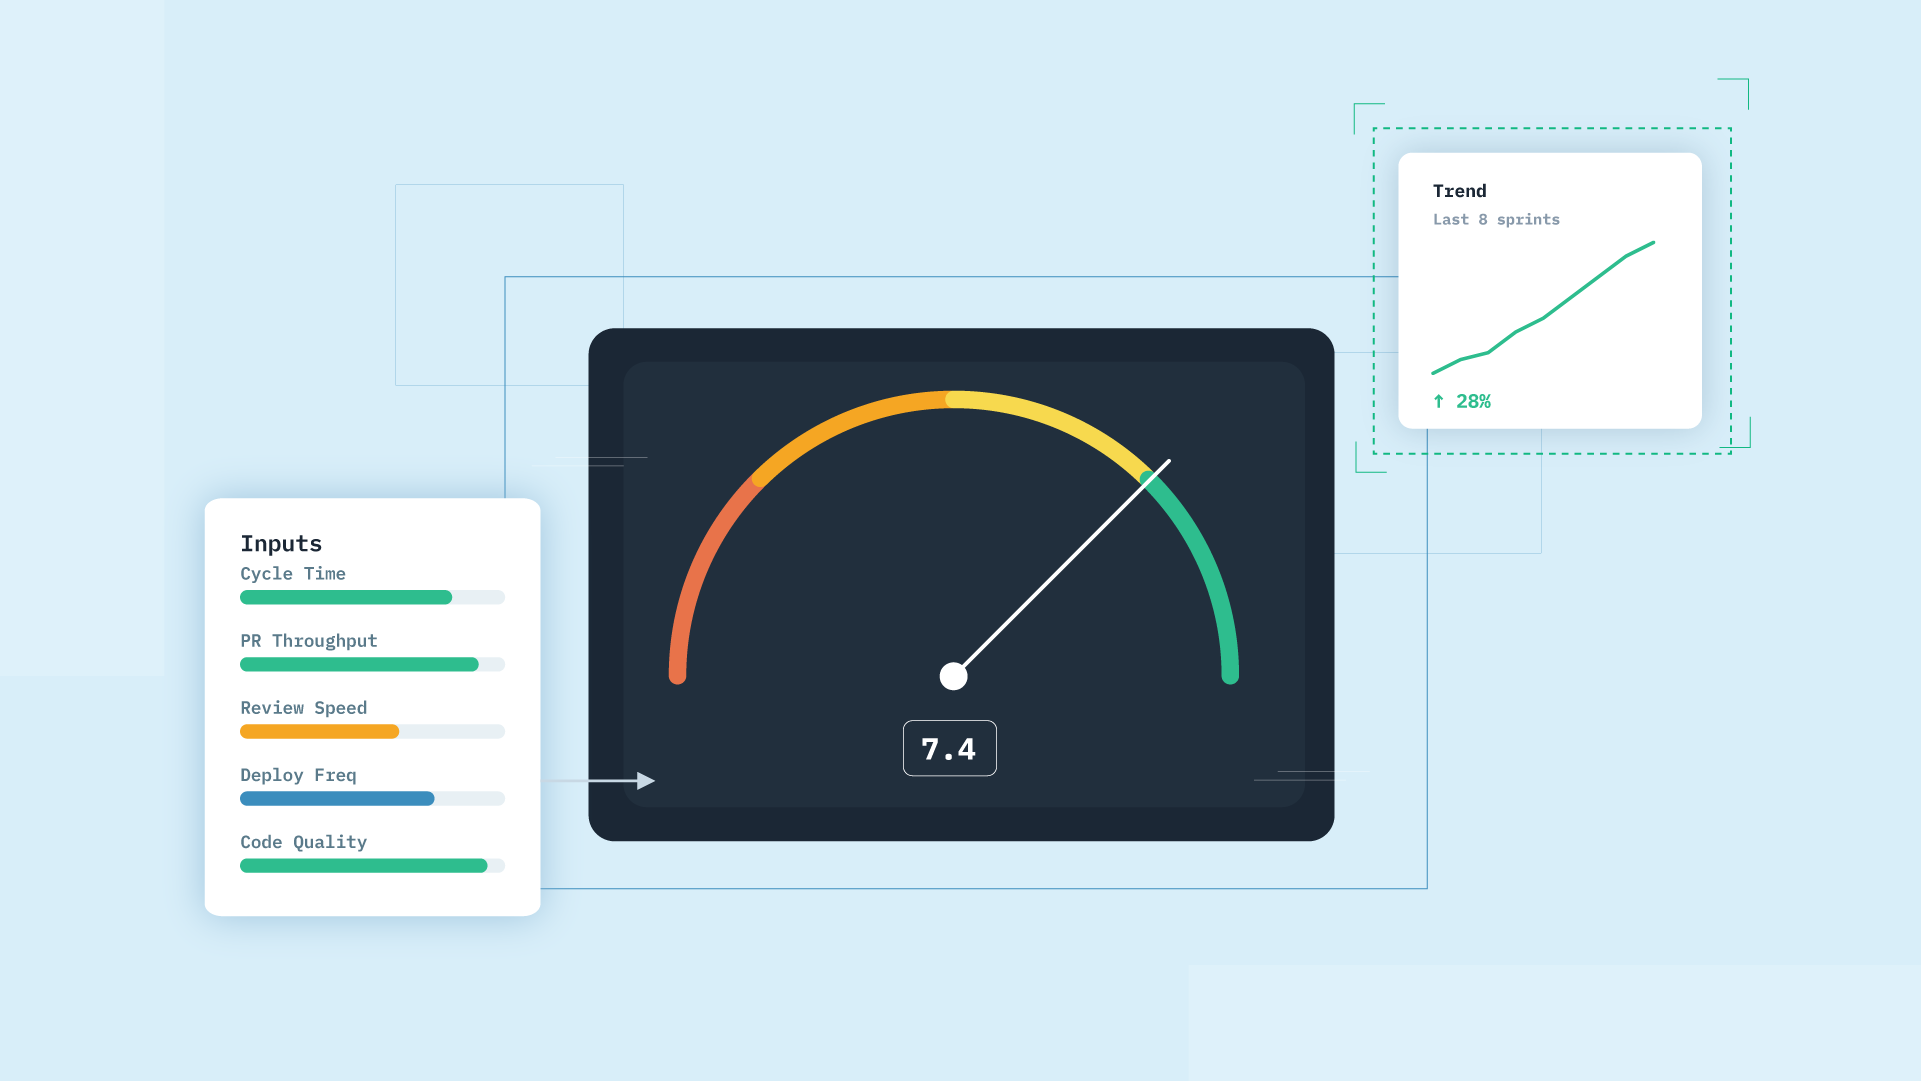
Ask three engineering leaders what velocity means and you may get three answers: story points per sprint, lines shipped, or a general sense of how fast the team feels. That confusion makes velocity easy to misuse. A useful delivery signal can quickly become a score for judging developers.
Velocity is worth defining carefully because it can show where work stalls and where an engineering leader should investigate. Used poorly, it creates pressure to increase activity and can push a team toward developer burnout.
This guide defines velocity in software development, separates it from sprint velocity and productivity, explains the metrics that measure it, and shows how to improve delivery speed without grinding the team down.
Developer velocity: key takeaways
- Velocity measures a delivery system. It describes how quickly and reliably a team turns ideas into shipped value, rather than how much code one person produces.
- Sprint velocity serves a narrower purpose. Story points help one team forecast capacity, while development velocity describes flow and quality across delivery.
- No single metric captures velocity. Flow metrics such as cycle time need stability metrics such as change failure rate for context.
- Sustainable improvement removes friction. Find the constraint, reduce delays, and measure the result at the team and process level.
What is velocity in software development?
Velocity in software development is the rate at which a team turns ideas into working, shipped value. It covers speed, quality, and the ability to absorb change across the delivery lifecycle, from starting work to running it safely in production.
The framing matters. Velocity is a diagnostic signal for finding friction in a system. A team with falling velocity may have a growing review queue, larger batches, slow handoffs, or a codebase that makes every change harder. A staged view of PR cycle time often reveals where that friction begins.
Read this way, development velocity points leaders toward the part of the system that needs attention. It does not explain the cause on its own, so the people closest to the work still need to interpret the signal.
Velocity vs. sprint velocity: clearing up the confusion
Sprint velocity and development velocity answer different questions. Sprint velocity counts the story points one team completes per sprint and supports planning. Development velocity shows how quickly and reliably work moves through the whole delivery system.
| Comparison point | Sprint velocity | Development velocity |
|---|---|---|
| What it measures | Story points completed per sprint | Flow and quality across the delivery lifecycle |
| What it is good for | Forecasting and capacity planning within one team | Finding friction and tracking delivery health over time |
| Common misuse | Comparing story points across teams or treating them as output | Ranking individuals instead of diagnosing the system |
Sprint velocity helps a team estimate what it can take into its next sprint. It becomes misleading when compared across teams because story points are local estimates, not a shared unit. Development velocity uses observable delivery signals such as elapsed time, throughput, deployment frequency, and reliability.
Velocity vs. productivity
Velocity measures delivery speed and flow. Productivity weighs the value and durability of what was delivered. A team can ship quickly while building the wrong capability, creating avoidable rework, or increasing technical debt.
| Question | Velocity | Productivity |
|---|---|---|
| Primary focus | How fast and reliably work moves | Whether the resulting output creates durable value |
| Typical signals | Cycle time, throughput, deployment frequency | Outcomes, quality, investment, and value delivered |
| Leadership use | Diagnose constraints in delivery | Evaluate whether engineering effort supports the right results |
Engineering leaders should read both together. Chasing speed alone can reward rushed changes and unsustainable working patterns. The broader approach in the SPACE framework helps teams balance flow with satisfaction, performance, activity, communication, and efficiency.
Why developer velocity matters
Higher sustainable velocity shortens feedback loops, reduces the cost of delay, and helps a team respond to new information. When small changes reach users regularly and reliably, the organization learns sooner and carries less half-finished work.
The business outcomes usually appear in three areas:
- Adaptability. A team with healthy flow can respond to a market shift or customer need while the information is still useful.
- Customer retention. Faster, reliable delivery reduces the wait for important fixes and improvements.
- Scaling. Predictable delivery helps an organization add teams without multiplying queues and handoff delays.
McKinsey's original Developer Velocity research discusses the relationship between software delivery capabilities and business performance. The practical job for an engineering leader is to show where delivery speed comes from in their own system and which constraint deserves attention.
How to measure software development velocity
No single number captures software development velocity. Pair flow metrics with stability metrics so a faster pipeline is always read alongside the quality and reliability of its output. A broader software development metrics guide can help place these signals in the rest of an engineering scorecard.
Cycle time
Cycle time measures the elapsed time from starting work to finishing it. It is a clear view of delivery flow because long cycle time often points to slow reviews, large batches, waiting, or repeated handoffs.
How to use it: break cycle time into stages such as coding, pickup, review, merge, and deploy. A staged report turns one duration into a map of the delay. Read more about why cycle time is a critical software delivery metric.
Deployment frequency
Deployment frequency measures how often a team ships to production. Frequent delivery with stable quality usually indicates smaller batches and a pipeline that can move changes safely.
How to use it: read deployment frequency next to change failure rate. An increase in deployments is useful when reliability remains healthy; otherwise, the team may simply be exposing production to more failed changes.
Lead time for changes
Lead time for changes measures the time from code committed to code running in production. It is one of the four DORA metrics and exposes friction between work being written and becoming available to users.
How to use it: track the trend over time instead of chasing one universal target. The distinction between lead time for changes and cycle time also matters because teams may define the start and end of each measure differently.
Throughput and sprint completion rate
Throughput counts work items completed in a period. Sprint completion rate shows the share of planned work that was delivered. Together, they reveal whether a team is shipping steadily and planning realistically.
How to use them: compare throughput trends with commitment and completion. A persistent gap can indicate over-planning, work entering after commitment, or a blocker that deserves investigation.
Change failure rate and MTTR
Change failure rate measures the share of deployments that cause a production failure. Mean time to recovery, or MTTR, measures how long the team takes to restore service. These stability signals keep delivery speed connected to reliability.
How to use them: if either measure worsens while flow gets faster, investigate the trade-off. Google's DORA research provides the original foundation for these measures, and this guide to the four DORA metrics explains how they work together.
Why velocity metrics are hard to measure
Velocity varies with team context, codebase maturity, architecture, and the type of work being delivered. A platform team and a product team can have very different cycle times for legitimate reasons. Direct rankings can punish teams handling the least predictable work.
Raw metrics also invite gaming when they become targets. They can hide external dependencies and miss valuable work that does not appear as a merged pull request, including mentoring, incident response, learning, and technical-debt reduction.
Use engineering benchmarks as directional context, with comparable teams and consistent definitions. Metrics should guide attention and open a conversation. They should never grade individuals or replace the judgment of the team doing the work.
How to improve developer velocity
Improve developer velocity by removing friction from the delivery system. Asking people for more effort rarely addresses a queue, a manual gate, unclear ownership, or a codebase that imposes a tax on every change.
Work through the levers in a deliberate order:
- Find the bottleneck with data. Map the delivery stages before changing the process.
- Fix tooling and automation. Remove repetitive manual work and unreliable handoffs.
- Reduce batch size. Smaller changes are easier to understand, review, and recover.
- Pay down technical debt. Protect capacity for the codebase constraints that slow future work.
- Strengthen review and collaboration. Prevent completed work from accumulating in a queue.
Change one meaningful constraint at a time, then watch the relevant trend. Simultaneous process changes make it harder to know which intervention helped.
Find the bottleneck before changing anything
Map where work stalls across coding, pickup, review, merge, and deployment. Many velocity problems concentrate in one stage, so improving a different stage creates local efficiency without improving the whole flow.
How to use it: compare stage-level cycle time over several weeks. Start with the stage that contributes the most waiting and confirm the diagnosis with the team before choosing an intervention.
Reduce batch size and review friction
Smaller pull requests are easier to review and usually spend less time waiting for feedback. Review speed also depends on ownership and reviewer availability, so a completed PR can sit idle even when its code is straightforward.
How to use it: track PR size and review turnaround together. Use a code review report to identify growing queues and rebalance reviewer load when one person or group becomes the constraint.
Pay down technical debt deliberately
Treat technical-debt reduction as scheduled work. Unaddressed debt increases the effort and risk attached to future changes, gradually reducing the capacity available for product delivery.
How to use it: make the investment trade-off visible through allocation data. Review how much time goes to maintenance, new capabilities, support, and unplanned work, then agree on capacity that protects both current delivery and future flow.
Measuring and improving velocity with DevStats
Choosing the right metrics is one challenge. Assembling them across Git, issue, deployment, and incident tools is another. DevStats is an engineering intelligence platform that connects those sources and brings cycle time, throughput, DORA metrics, and benchmarks into a shared view.
The approach stays diagnostic. DevStats shows where flow breaks down, such as rising pickup time or an uneven review queue, and the engineering leader decides what to change. Measurement stays at the team and process level, which keeps velocity focused on improving the system.
See where your delivery slows down
Velocity is useful when you can see where it changes. Connect your existing tools to view live cycle time, throughput, reliability, and benchmarks without building the reporting by hand.
Start a free trial and find where your delivery flow actually slows down.
Frequently asked questions
What is velocity in software development?
Velocity in software development is the rate at which a team turns ideas into working, shipped value across the delivery lifecycle. It measures the flow of a team and its system, rather than the volume of code or the effort of an individual.
What is the difference between velocity and sprint velocity?
Sprint velocity is the number of story points one team completes per sprint and is used for planning and forecasting. Development velocity is the broader measure of how quickly and reliably work flows through delivery, using signals such as cycle time, throughput, and reliability.
How do you measure developer velocity?
Measure developer velocity with a mix of flow and stability metrics: cycle time, deployment frequency, lead time for changes, throughput, change failure rate, and MTTR. Track their trends together so increased speed is interpreted in the context of delivery health.
Is velocity a good measure of productivity?
Velocity is one part of a productivity picture because it measures delivery speed and flow. Productivity also considers the value, quality, and durability of what the team delivers, so leaders should evaluate both at the team level.