
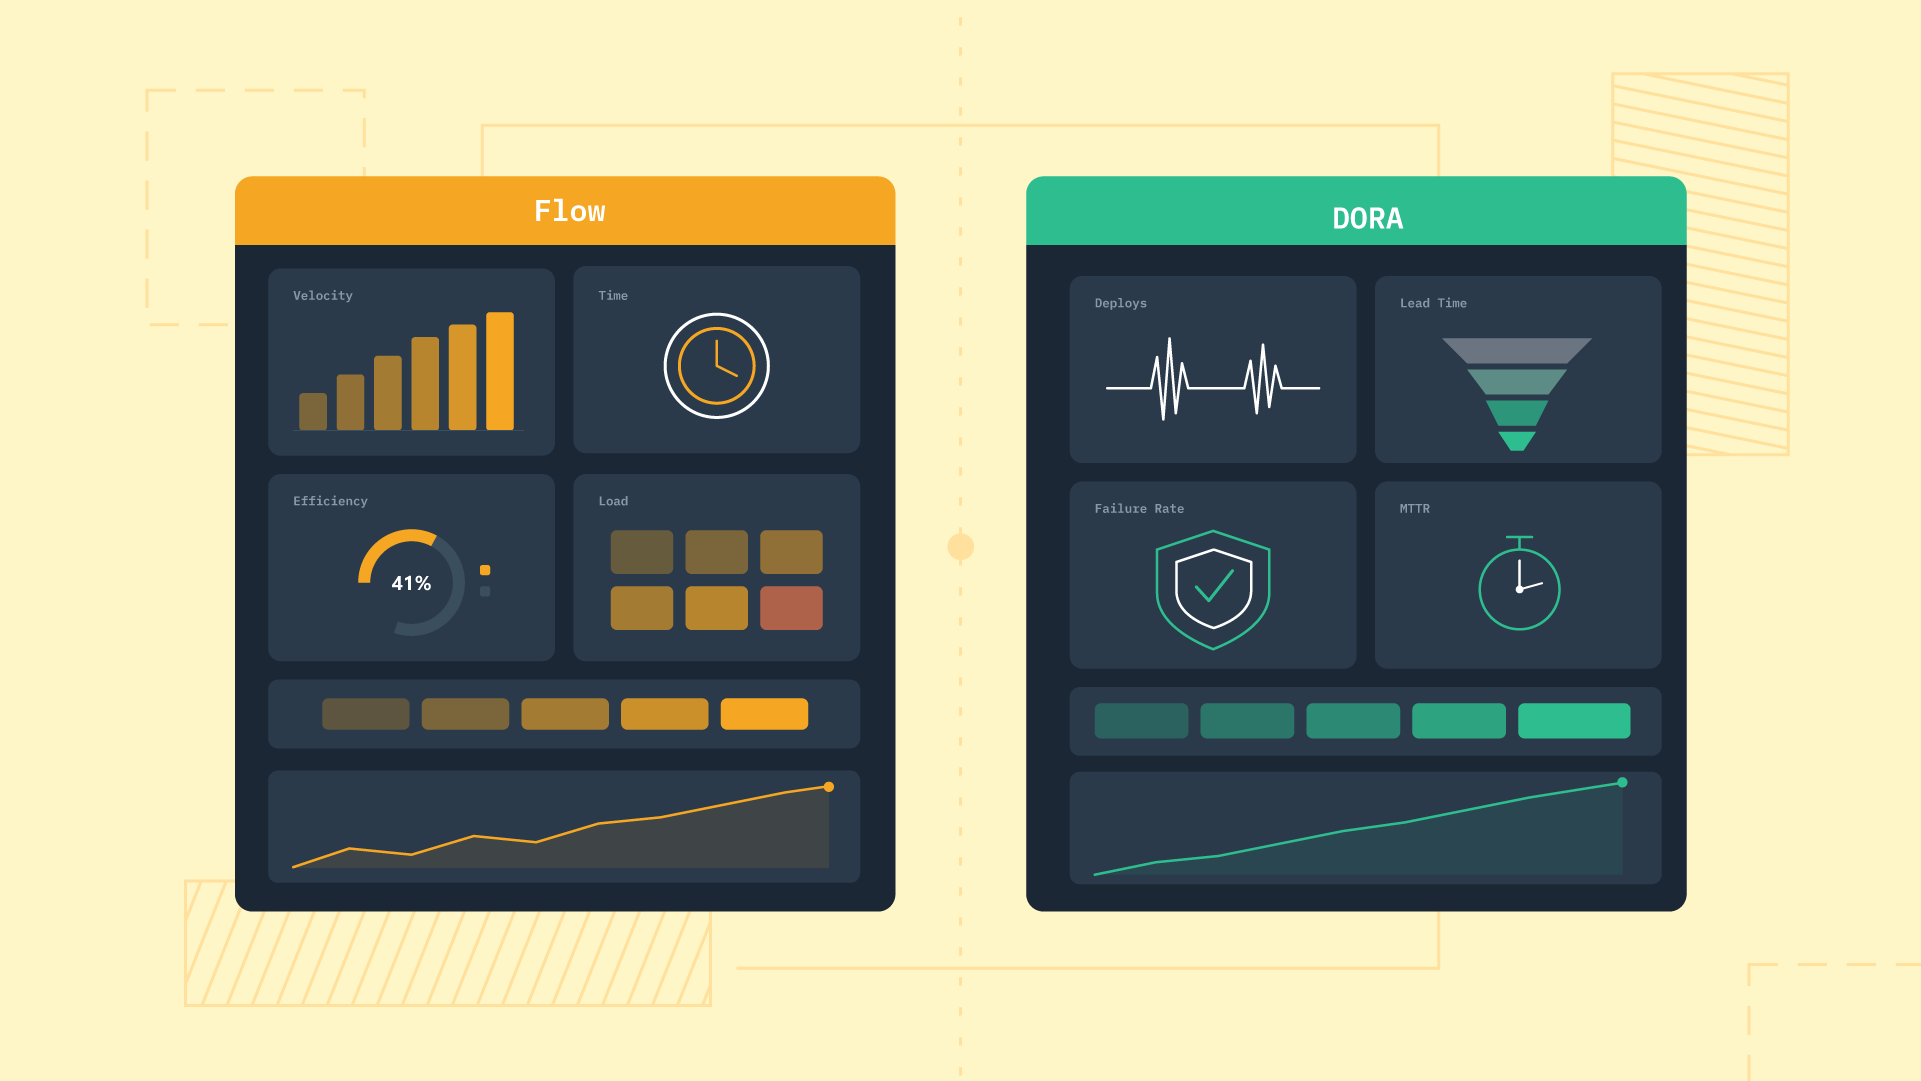
 Here is the verdict most comparisons refuse to give: DORA tells you what your delivery outcomes are, and flow metrics tell you why they look that way.
They are not rivals, and you do not have to pick one forever. For most teams the answer to "which first" is DORA, because it is simpler to instrument and the data comes straight from Git and CI. You add flow metrics once you need to explain a number rather than just watch it move.
Here, we define both sets, compare them side by side, name where they honestly overlap, answer which to track first for which team, and show how to read them together, treating both as diagnostic instruments rather than scoreboards.
Flow metrics vs DORA metrics: key takeaways
- DORA measures delivery outcomes, speed and stability, while flow metrics measure how work moves through the whole value stream from the moment it enters the system.
- The two overlap: flow time and DORA lead time are close cousins, and the real difference is scope, since DORA starts at commit and flow starts when work is requested.
- Most teams should start with DORA because it needs no process change, then add flow metrics to explain why a DORA number moved.
- Read together, DORA spots that something changed and flow shows where and why, which is the pair that actually drives an intervention.
- Start a free DevStats trial and see your delivery outcomes and bottlenecks side by side in under 2 minutes, with no code changes.
What are DORA metrics?
DORA metrics are four measures of software delivery performance: deployment frequency (how often you ship), lead time for changes (commit to production), change failure rate (share of deployments that fail), and time to restore service (how fast you recover).
Together they capture the two halves of delivery, speed and stability. DevStats surfaces all four DORA metrics in one dashboard, so you can track them without stitching the data together by hand.
They come from Google's DORA research and are the most widely adopted delivery benchmark going. For the full breakdown, see what are the DORA metrics and measuring and improving software delivery with DORA metrics.
The key point for this comparison is what DORA is: an outcome scoreboard. It tells you your delivery got slower or less stable, and that is exactly why it cannot tell you where the problem sits or what to do about it.
What are flow metrics?
Flow metrics measure how work moves through the value stream, from the moment an item is requested to the moment it is delivered. They come from the Flow Framework developed by Mik Kersten, and they are often called value stream metrics, which is the same idea under a different name.
Where DORA watches the delivery pipeline from commit onward, flow metrics watch the entire journey a piece of work takes, including all the time it spends waiting before anyone touches it. There are five, and each answers a different question about that journey. The Flow view is where these come together in practice.
Flow time
Flow time is the total elapsed time for a work item from start to finish, including every wait along the way. It is the flow answer to "how long does work actually take," measured from the customer's or requester's point of view rather than the developer's.
How to use it: compare it against hands-on time to see how much of the total is waiting rather than working. That gap is usually larger than anyone expects, which is what makes flow time worth measuring, and it relates closely to why cycle time is the most important metric.
Flow efficiency
Flow efficiency is the share of flow time that a work item is actively being worked on rather than sitting idle. It is the most revealing flow metric, because most teams find that the majority of a work item's elapsed time is wait, not work.
How to use it: a low percentage points at handoffs, review queues, and blocked dependencies, not at slow developers. This is the metric most easily misread as a measure of effort, so it is worth stating plainly that low flow efficiency indicts the system, not the people in it.
Flow velocity
Flow velocity is the number of work items completed in a given period, the throughput view of flow. It shows delivery pace without the estimation baggage of story points, since it counts finished items rather than points.
How to use it: watch the trend rather than the absolute number, because item size varies and a single period's count means little on its own. Throughput tracked over time is the usable signal.
Flow load
Flow load is the number of items in progress at once, the work-in-progress view of the system. High flow load usually drags flow time up, because context switching multiplies wait and nothing finishes while everything is half-done.
How to use it: pair it with flow time to make the case for WIP limits. When load climbs and flow time climbs with it, you have the evidence to argue for finishing work before starting more.
Flow distribution
Flow distribution is the breakdown of work by type across features, defects, risk, and debt. It exposes whether the team is building new value or absorbing maintenance, which is often invisible until it is measured.
How to use it: bring it to roadmap conversations when capacity assumptions do not match reality. It is the metric that turns "we never have time for features" into a number, and it pairs naturally with how to deal with unplanned work.
Flow metrics vs DORA metrics compared
The clearest way to hold the difference is side by side. DORA and flow metrics answer different questions from different data, and each misses what the other captures.
| DORA metrics | Flow metrics | |
|---|---|---|
| What they measure | Delivery outcomes: speed and stability | How work moves through the value stream |
| Question they answer | What are our delivery results? | Where and why does work slow down? |
| Where the data comes from | Git and CI/CD pipelines | The issue tracker and value stream |
| Scope | Commit to production | Request to delivery, including all wait |
| Who uses them | Leaders benchmarking delivery health | Teams diagnosing where work stalls |
| What they miss | Where the bottleneck sits | Production stability and failure rate |
The table makes the relationship obvious. DORA is the outcome, flow is the explanation, and a team watching only one is either seeing results with no cause or seeing process with no production reality.
Where the two sets overlap
The honest concession the comparison usually skips: flow time and lead time for changes measure close to the same thing, and flow velocity sits near deployment frequency in spirit. If you already track one set, part of the other is not new information.
The real difference is scope. DORA lead time starts at commit, while flow time starts when work enters the system, so flow captures the backlog wait, the refinement delay, and the pickup lag that DORA never sees. This is the same distinction we draw out in lead time versus cycle time, and issue cycle time is where that earlier window becomes visible.
So tracking both does not mean tracking twice as much. It means widening the window on the same delivery pipeline, from the full request-to-release journey down to the commit-to-production core, and reading the two zoom levels together.
Which should your team track first?
Answer the question directly rather than hedging. The right starting point depends on where your team is and where the real story lives:
- Start with DORA if you are new to measurement, since the data comes straight from Git and CI and needs no process change to collect.
- Start with DORA if you need a delivery benchmark to report upward, because the performance bands give you an external reference.
- Lead with flow metrics if the team already ships steadily but cannot explain why work sits, which is a wait-time problem DORA cannot locate.
- Lead with flow metrics if the issue tracker holds the real story, meaning most of your delay happens before code is ever committed.
For most teams that sequence is DORA first, flow second. You instrument the outcome, notice a number you cannot explain, and reach for flow metrics to find the cause.
How to use flow and DORA metrics together
The practical pattern is simple: read DORA to spot that something moved, then read flow to find where and why. DORA is your alarm, flow is your investigation.
Take a worked example. Your DORA lead time climbs over a quarter, which tells you delivery slowed but nothing about the cause. You pull flow efficiency and find it dropped in the same period, which means work items spent more of their life waiting rather than being worked on.
That points you at wait time, so you look at flow load and see WIP climbed, and now you have a hypothesis: the team took on too much at once, context switching rose, and things sat half-done. A staged view of PR cycle time confirms which stage absorbed the wait.
You stay the decision-maker throughout. The two metric sets hand you a hypothesis; you decide the intervention, whether that is a WIP limit or a review-routing change, and then check whether the numbers moved.
Common mistakes when tracking flow and DORA metrics
A few predictable errors turn two useful metric sets into noise. Each carries a consequence worth catching early:
- Tracking both without deciding what question each answers, which produces a crowded dashboard nobody reads instead of a diagnosis.
- Comparing flow efficiency across unlike teams, since a platform team and a feature team have legitimately different profiles and the comparison just misleads.
- Treating any metric as a target, which invites gaming and makes the number stop reflecting reality.
- Using either set to evaluate individuals, which measures the wrong thing and breaks trust.
That last one is the hard line. Flow and DORA metrics measure processes, not people, and flow efficiency in particular is a statement about the system's wait time rather than any developer's effort. Keep both at the team level, where they describe a workflow you can improve together.
Tracking flow and DORA metrics with DevStats
Reading the two sets together means stitching Git data and issue-tracker data into one view, which is tedious to do by hand and easy to get wrong.
DevStats is an engineering intelligence platform that connects your existing Git, issue, and incident tools and surfaces DORA metrics alongside cycle time and flow signals with benchmarks.
The framing stays diagnostic. DevStats shows you both the outcome and the where, that lead time rose and the wait concentrated in the review stage, and you decide the intervention.
Everything is measured at the process level, never as individual rankings, because the point is to widen your view of the pipeline rather than to score the people working in it.
See both views of your delivery pipeline
Stop guessing why delivery slowed. Connect your Git, issue, and incident tools and DevStats surfaces your DORA outcomes right next to your flow bottlenecks, benchmarked against 1,000+ engineering teams, so you can see exactly where work stalls and decide what to change.
Setup takes under 2 minutes with no code changes, and teams that read both views ship up to 30% faster.
Start a free trial and get both views of your pipeline working for you today.
Frequently asked questions
What is the difference between flow metrics and DORA metrics?
DORA metrics measure delivery outcomes, speed and stability, using data from Git and CI, while flow metrics measure how work moves through the whole value stream from request to delivery. DORA tells you what your results are; flow tells you where and why work slows down. The main scope difference is that DORA starts at commit while flow starts when work first enters the system.
Should you track both flow and DORA metrics?
Most teams benefit from both, but not at the same time. Start with DORA because it needs no process change and gives you a delivery benchmark, then add flow metrics when you need to explain why a DORA number moved. Tracking both is not double the work, since the two sets overlap and widen the same view rather than duplicating it.
What is flow efficiency?
Flow efficiency is the share of a work item's total elapsed time that it spends being actively worked on rather than sitting idle. A low percentage means most of the time is wait, caused by handoffs, review queues, or blocked dependencies, which points at the system rather than at developer effort. It is often the most revealing flow metric because the wait share is usually much larger than teams expect.
Are flow metrics the same as value stream metrics?
Yes, flow metrics and value stream metrics refer to the same set of measures for how work moves through the delivery system. The five come from the Flow Framework: flow time, flow efficiency, flow velocity, flow load, and flow distribution. The "value stream" name emphasizes that they track the entire journey of work, not just the coding stage.