
The fastest way to make a DevOps dashboard useless is to track everything from day one. A team three weeks into setting up CI does not need a reliability dashboard. It needs to know whether deployments are succeeding, and burying that signal under fifteen others guarantees nobody reads any of them.
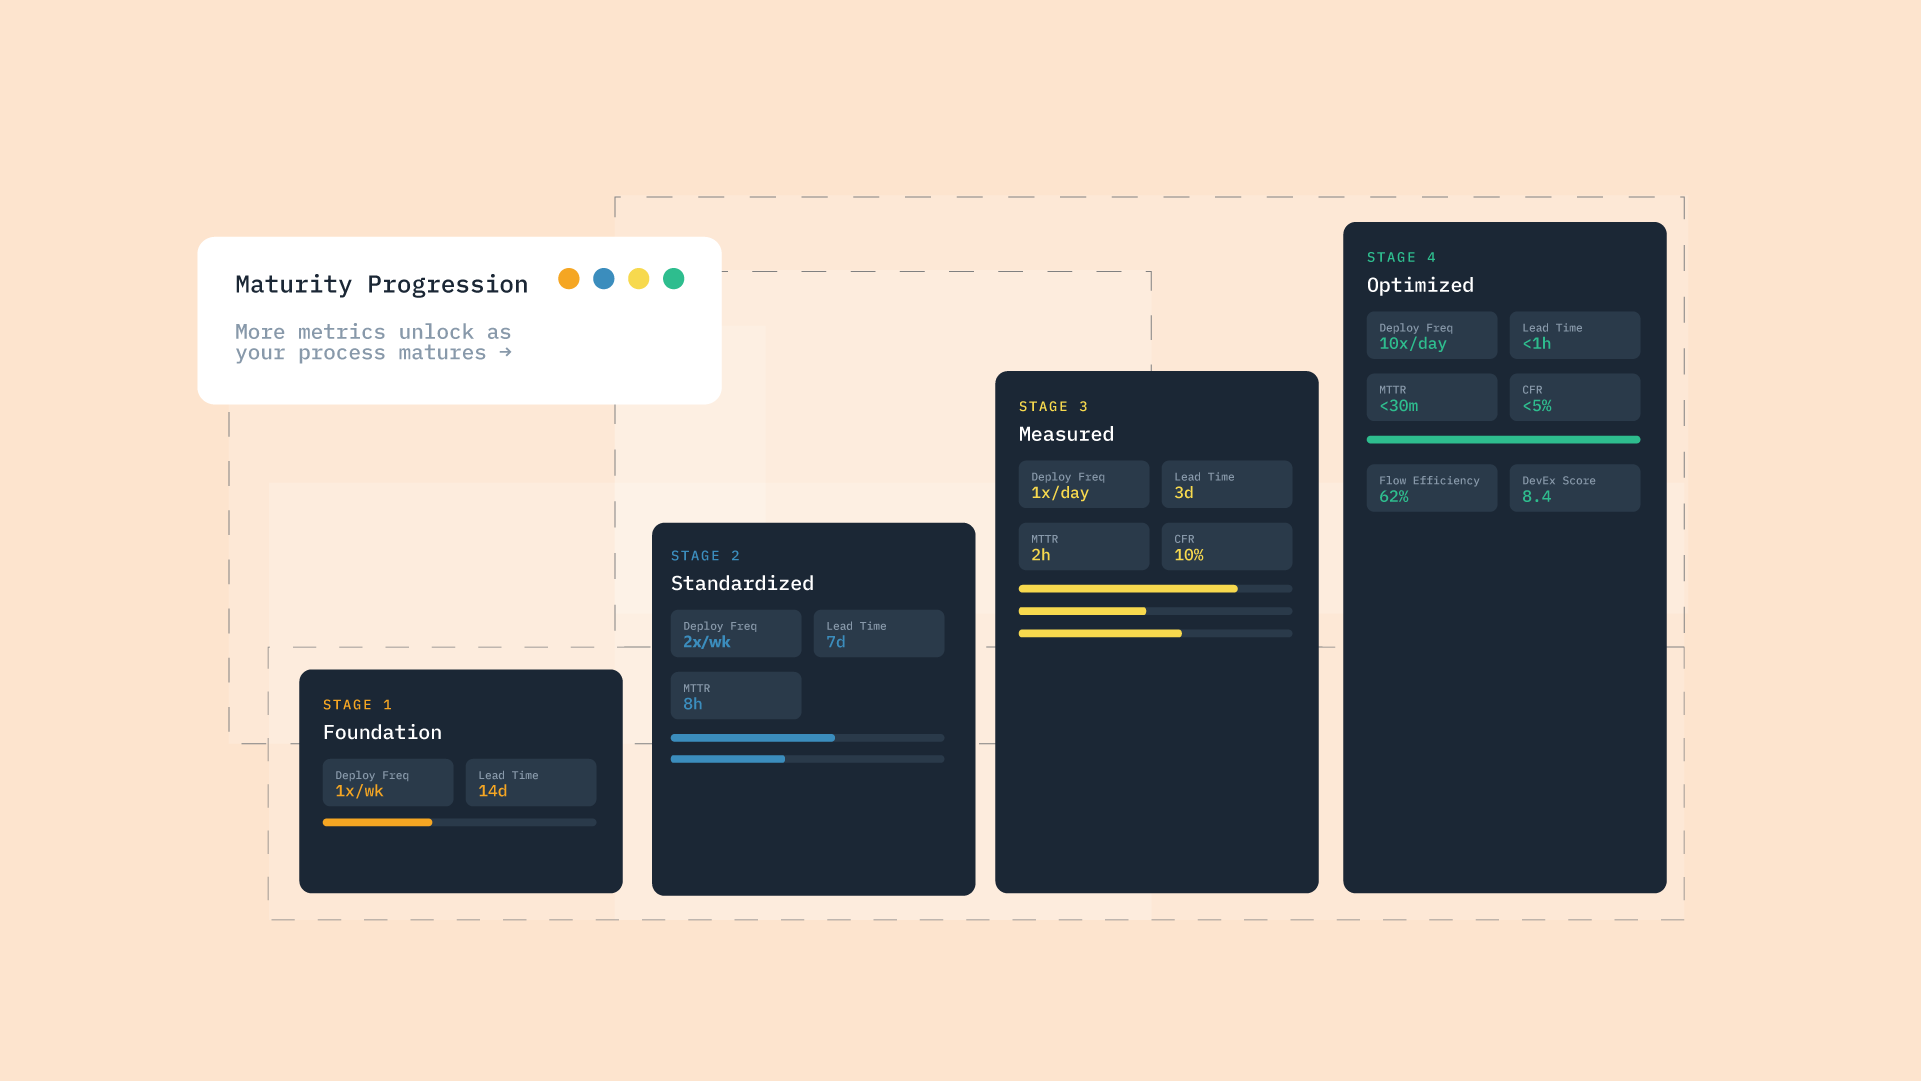
The metrics that matter change as a team matures. What a forming team should watch differs from what a team optimizing a mature pipeline should watch, and treating every metric as equally urgent is how dashboards become wallpaper.
This guide defines DevOps metrics and KPIs, gives the core set with a note on how to use each, maps them to your maturity stage, and covers the mistakes that turn measurement into noise.
DevOps metrics and KPIs: key takeaways
- DevOps metrics measure delivery health. They show the speed, stability, and quality of how you build and ship; KPIs are the small subset tied to a specific goal.
- Every KPI is a metric, but few metrics should be KPIs. Picking too many is the most common measurement mistake.
- DORA is the foundation. The four DORA metrics, plus a few operational and flow signals, are the core set most teams should anchor on.
- Maturity determines priority. Forming teams start with a couple of stability signals; mature teams layer in flow and reliability metrics.
- Benchmarking adds context. DevStats shows your delivery data alongside comparable teams so you can interpret the direction of travel.
What are DevOps metrics and KPIs?
DevOps metrics measure the speed, stability, and quality of how a team builds and ships software. KPIs are the subset tied to a specific goal. A metric is any measurement you can take; a KPI is one you have committed to because it maps directly to a delivery outcome you care about.
All KPIs are metrics, but not all metrics are KPIs. Lines of code is a metric and almost never a KPI because no useful decision follows from it. Deployment frequency becomes a KPI when you tie it to a goal such as shipping smaller batches.
Read metrics as a diagnostic readout that tells you where to look, not a verdict on people. A number that moved is a prompt to investigate the system.
Metrics vs KPIs in DevOps
A metric is any measurement; a KPI is the handful you commit to because they map to a delivery outcome. The difference is intent, not the number itself, since the same metric can be a KPI for one team and background data for another. Our overview of software development metrics expands on the distinction.
| Comparison | Example metric | Example KPI |
|---|---|---|
| What it is | Lines of code written | Deployment frequency |
| What it tells you | Activity volume that is easily gamed | Whether batch size and pipeline health are improving |
| Does it drive a decision? | Rarely | Yes, when tied to a shipping goal |
Picking too many KPIs is the most common mistake teams make. When a dashboard flags fifteen "key" indicators, none drives a decision and the team learns to ignore the whole thing.
The core DevOps KPI metrics to track
Most teams should anchor on the four DORA metrics plus a small set of operational and flow KPIs. For a fuller introduction, see what the DORA metrics are and the four DORA metrics.
Deployment frequency
Deployment frequency counts how often code reaches production. It is a read on batch size and pipeline maturity: a high cadence paired with steady quality points to a well-automated pipeline, while rare deploys often signal large, high-risk releases.
How to use it: Pair it with change failure rate so speed is never read in isolation. Deployment tracking makes the trend visible.
Lead time for changes
Lead time for changes measures how long a commit takes to reach production. It is the clearest single read on delivery speed; long lead times usually point to slow reviews, manual steps, or batching rather than slow developers.
How to use it: Split it by stage to see where the hours accumulate. A staged view of PR cycle time shows where work stalls, and our guide explains lead time for changes versus cycle time.
Change failure rate
Change failure rate is the percentage of deployments that cause a failure needing a fix or rollback. It keeps a fast team honest by exposing whether speed is costing stability.
How to use it: Read it against deployment frequency to judge whether velocity is safe or reckless. Together, the two separate shipping fast and well from shipping fast and breaking things.
Mean time to recovery
Mean time to recovery is how long it takes to restore service after a production failure. It is the resilience KPI: mature teams recover quickly because monitoring, runbooks, and easy rollbacks are ready before an incident.
How to use it: Track it alongside mean time to detect so detection and repair are tuned separately. Slow recovery caused by slow detection is a monitoring problem, not a fix-it-faster problem.
Operational reliability metrics: MTTF, MTTD, and MTBF
The incident-timing family belongs together. Mean time to failure is how long a system runs before breaking, mean time to detect is how long until you notice, and mean time between failures is the interval between incidents. A weak number in any one exposes a specific weakness, from fragile components to blind spots in monitoring.
How to use them: Use detection and failure intervals to prioritize monitoring and test-coverage investment. They tell you whether to improve observability or the reliability of a component.
DevOps KPI examples by goal
The clearest way to choose KPIs is to start from the goal. A KPI earns its place by proving progress toward something, so this table maps common goals to the signal that demonstrates progress without inventing target numbers.
| Goal | KPI that proves it | Healthy direction |
|---|---|---|
| Ship faster | Lead time for changes | Down |
| Ship more often, safely | Deployment frequency with change failure rate | Frequency up; failure rate flat or down |
| Fewer outages | Mean time between failures | Up |
| Recover faster | Mean time to recovery | Down |
| Better quality | Change failure rate | Down |
Treat this as a starting point, not a scorecard. Direction of travel matters more than any absolute number early on, while benchmarks give you context for whether your current level is normal for teams like yours.
Matching DevOps KPIs to your maturity stage
An early team and a mature team should not track the same KPIs. A forming team should start with a couple of stability signals and build the habit of measuring; a mature team layers in flow and reliability KPIs after the pipeline is automated. Picking the two or three that fit your stage beats drowning in a dashboard on day one.
Forming and establishing the pipeline
At this stage CI is new and data is thin, so start with deployment success rate and deployment frequency. The goal is a baseline, not optimization, because you cannot improve against numbers you never captured. In practice, this is owned by the team lead setting up the toolchain.
Standardizing and scaling
Once delivery is automated, add lead time for changes and change failure rate to balance speed with stability. KPIs now drive decisions about review and testing instead of simply confirming the pipeline runs. In practice, the engineering manager owns this stage.
Optimizing and fine-tuning
A mature team layers in mean time to recovery, reliability metrics, and flow signals such as cycle time to find marginal gains. The focus shifts from whether you are measuring to where the next bottleneck is. This is where measuring and improving software delivery with DORA metrics becomes a practical operating rhythm.
In practice, the VP of Engineering owns this stage and reports organization-level health.
How to choose the right DevOps KPIs
Pick KPIs that map to a current goal, are hard to game, and balance speed against stability so no number can be chased blindly. The best KPI is tied to the problem you are trying to solve this quarter, not the one a competitor put on a blog.
Avoid vanity metrics such as raw commit counts or lines of code. They measure activity rather than outcomes and reward the wrong behavior. Fewer, well-chosen KPIs beat a crowded dashboard nobody acts on.
Common mistakes when tracking DevOps metrics
A handful of predictable errors turn DevOps measurement into noise:
- Tracking too many KPIs. This buries the signal and teaches the team to ignore the dashboard.
- Using metrics to rank individuals. This measures the wrong thing and invites gaming.
- Ignoring context. Comparing a regulated team with consumer SaaS and calling the difference a failure removes the constraints that explain the data.
- Optimizing one number at the expense of another. Pushing deployment frequency while change failure rate rises is faster breakage, not progress.
The individual-ranking trap deserves a hard line. DevOps metrics measure processes, not people. Once they become a scorecard for engineers, the numbers stop reflecting reality because everyone optimizes for their own figure.
Turning DevOps KPIs into action with DevStats
Knowing which KPIs to track is one thing; pulling them from Git, issue, and incident tools by hand is a job that never ends. DevStats is an engineering intelligence platform that connects those tools and surfaces these KPIs with DORA reporting and benchmarks, so you can see how you compare to teams at your stage.
The framing stays diagnostic. DevStats shows where work stalls and how your numbers compare; you decide whether the intervention is automation, review changes, or a staffing conversation. Everything is measured at the process level, never as individual rankings.
See your DevOps KPIs in one place
KPIs scattered across five tools are KPIs nobody reads. Connect your existing tools and DevStats shows live delivery metrics and benchmarks in one place, set up in under two minutes with no code changes.
Start a free trial and put your DevOps KPIs in one view.
Frequently asked questions
What is a KPI in DevOps?
A KPI in DevOps is a metric you have committed to because it maps directly to a delivery goal, such as deployment frequency tied to shipping smaller batches. All KPIs are metrics, but a metric becomes a KPI only when a real decision depends on it.
What is the difference between DevOps metrics and KPIs?
A metric is any measurement of how you build and ship, while a KPI is the small subset chosen because it maps to a delivery outcome. Lines of code is a metric that rarely qualifies as a KPI; deployment frequency tied to a goal does.
What are the most important DevOps KPIs?
Most teams should anchor on the four DORA metrics: deployment frequency, lead time for changes, change failure rate, and mean time to recovery. These cover speed and stability, which need to be read together so faster never quietly means worse. Layer in reliability and flow metrics as the team matures.
What are examples of DevOps KPIs?
Common examples include deployment frequency, lead time for changes, change failure rate, mean time to recovery, and reliability metrics such as mean time between failures. Choose the few that map to your current goal instead of tracking all of them at once.