Pronto para começar a usar o DevStats?

Não é necessário cartão de crédito

Acesso total a todos os recursos

Configuração de 2 minutos

The software development lifecycle (SDLC) refers to the overall process of building and maintaining software. It's the iterative cycle of planning, implementing, and improving changes that deliver value to users.
Cycle time is the key metric used to understand SDLC performance. It measures the average time taken to complete a work item, such as a new feature or bug fix, from start to finish. Generating cycle time reports for your tasks can help you identify SDLC bottlenecks and inefficiencies, allowing you to make targeted changes that increase your software delivery throughput.
This article will explain how tracking cycle time benefits DevOps teams and then show you how to interpret cycle time reports so you can accurately analyze your development activity. You'll also cover some of the common challenges and misconceptions associated with cycle time data.
Understanding Cycle Time
Cycle time is the average time taken to complete a single development cycle representing a specific task. A new cycle begins when you start planning a feature or improvement. The cycle finishes once the change has been shipped to users, with the cycle time measuring the total duration that's elapsed.
Cycle time is a good indicator of your SDLC's efficiency. Shorter cycle times suggest you're benefiting from a tight iterative feedback loop that lets you rapidly build and deploy changes as they're needed. This makes it more likely your projects will succeed when compared with longer cycles that can restrict developer access to test results and other SDLC insights. Smaller cycles also mean changes reach users more quickly, letting you begin validating new concepts earlier before you've invested too much development time.
Benefits of Tracking Cycle Time
Tracking cycle time lets you assess your DevOps maturity by revealing how well your processes can ship small changes frequently. Some of the benefits include the following:
- Exposes development-process bottlenecks: Increased cycle time compared to peers or a historical benchmark can expose bottlenecks, such as slow manual review stages or suboptimal tooling.
- Supports team-velocity predictions: Understanding your average cycle time for different work types, such as new features and bug fixes, allows you to make more informed scheduling estimates. Product managers will be able to accurately predict when work will be ready, based on the historical cycle time data for similar changes.
- Lets you track progress towards project goals: Cycle time values can help you gauge a project's progress and estimate how much time remains, based on the cycle durations of the features that have already been delivered.
- Facilitates data-driven decision-making: Cycle time measures performance across the entire SDLC, letting you make informed decisions about areas that need to be optimized to improve efficiency—for example, if one project's deployment cycle time is consistently higher than others, then this could indicate that additional DevOps tooling is required.
Hence, regularly reviewing cycle time data allows you to identify DevOps performance trends and assess the results of changes you make. By guiding you towards shorter cycles, it can help you increase your team's throughput and gain a competitive advantage by shipping smaller changes more responsively.
Cycle Time Reports
Cycle time reports are graphical visualizations that show how cycle time is distributed across time and work types. Within the reports, grouped bar charts, line graphs, and scatter plots clearly distinguish different kinds of development activity. This helps identify which work is taking developers the most time.
The following layout from [DevStats](https://www.devstats.com) illustrates a typical cycle time report. The bar chart provides a clear overview of how the cycle duration changes over the report time frame, with the blocks inside each bar conveying which task types are consuming the most time.
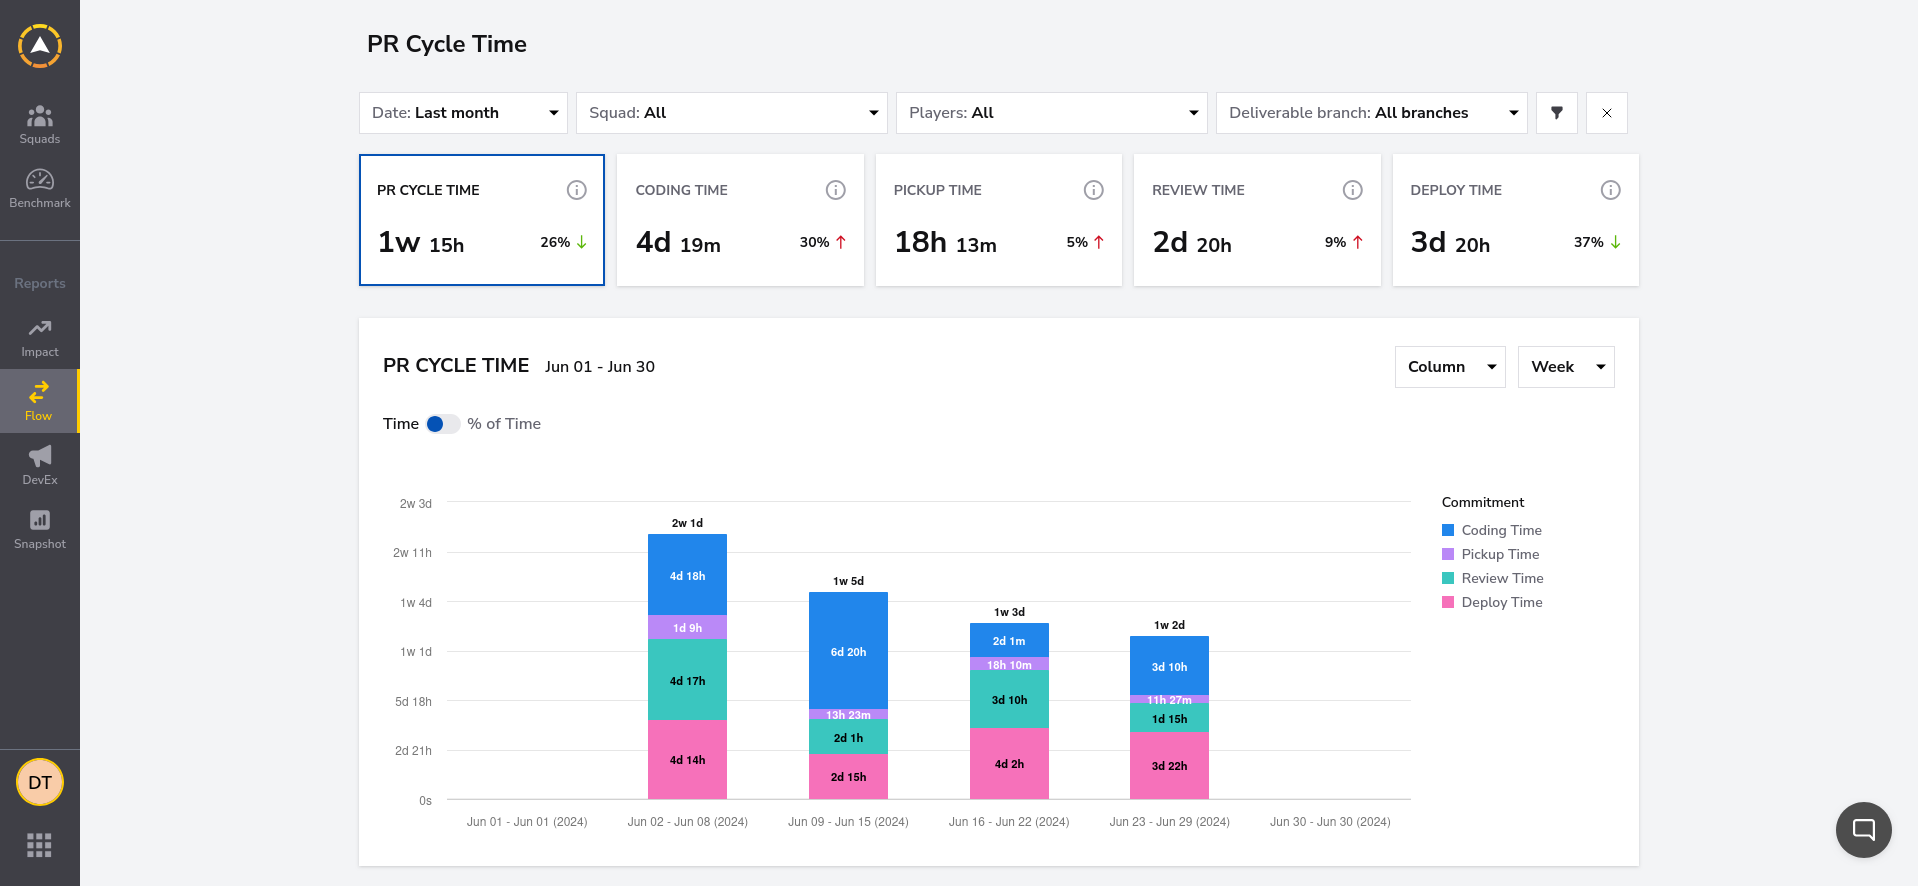
Tools that generate cycle time reports should include the following features:
- Ability to customize the report time frame: This allows you to track changes in performance as your teams and projects develop.
- Break down cycles by SDLC stage: The ability to view and filter activity for specific SDLC phases—such as planning, development, testing, and deployment—lets you see exactly where bottlenecks are occurring.
- Compare cycle durations for different work items: Cycle time reports allow you to drill down to work types, such as feature stories, improvements, and bugs. Comparing different categories can reveal whether performance issues affect all tasks or if problems are only occurring for specific types of work—perhaps due to the additional pressure experienced by developers building large features or time-critical bug fixes.
- Facilitate trend analysis: These reports also allow you to track whether optimization efforts are successful by summarizing cycle duration trends, such as with trend lines on graphs or providing percentage change figures for each time period.
These capabilities enable you to examine cycle time and any changes that occur, facilitating an informed assessment of developer activity and velocity.
Reading and Interpreting a Cycle Time Report
Let's take a closer look at the DevStats cycle time report:

There are some key characteristics and controls to note:
- The filters at the top of the screen allow you to customize the report time frame, teams (squad), developers (players), and code branches that are displayed, giving you access to the specific data you require.
- Below these controls, cards provide an at-a-glance view of the cycle durations associated with the main SDLC phases—including overall pull request cycle time, from code through to production, and individual cycle times for the coding, pickup, review, and deploy stages.
- The graph is where you can conduct a detailed trend analysis to see how cycle time is changing over time. This also enables you to easily visualize how the different development phases are contributing to your overall cycle time metrics.
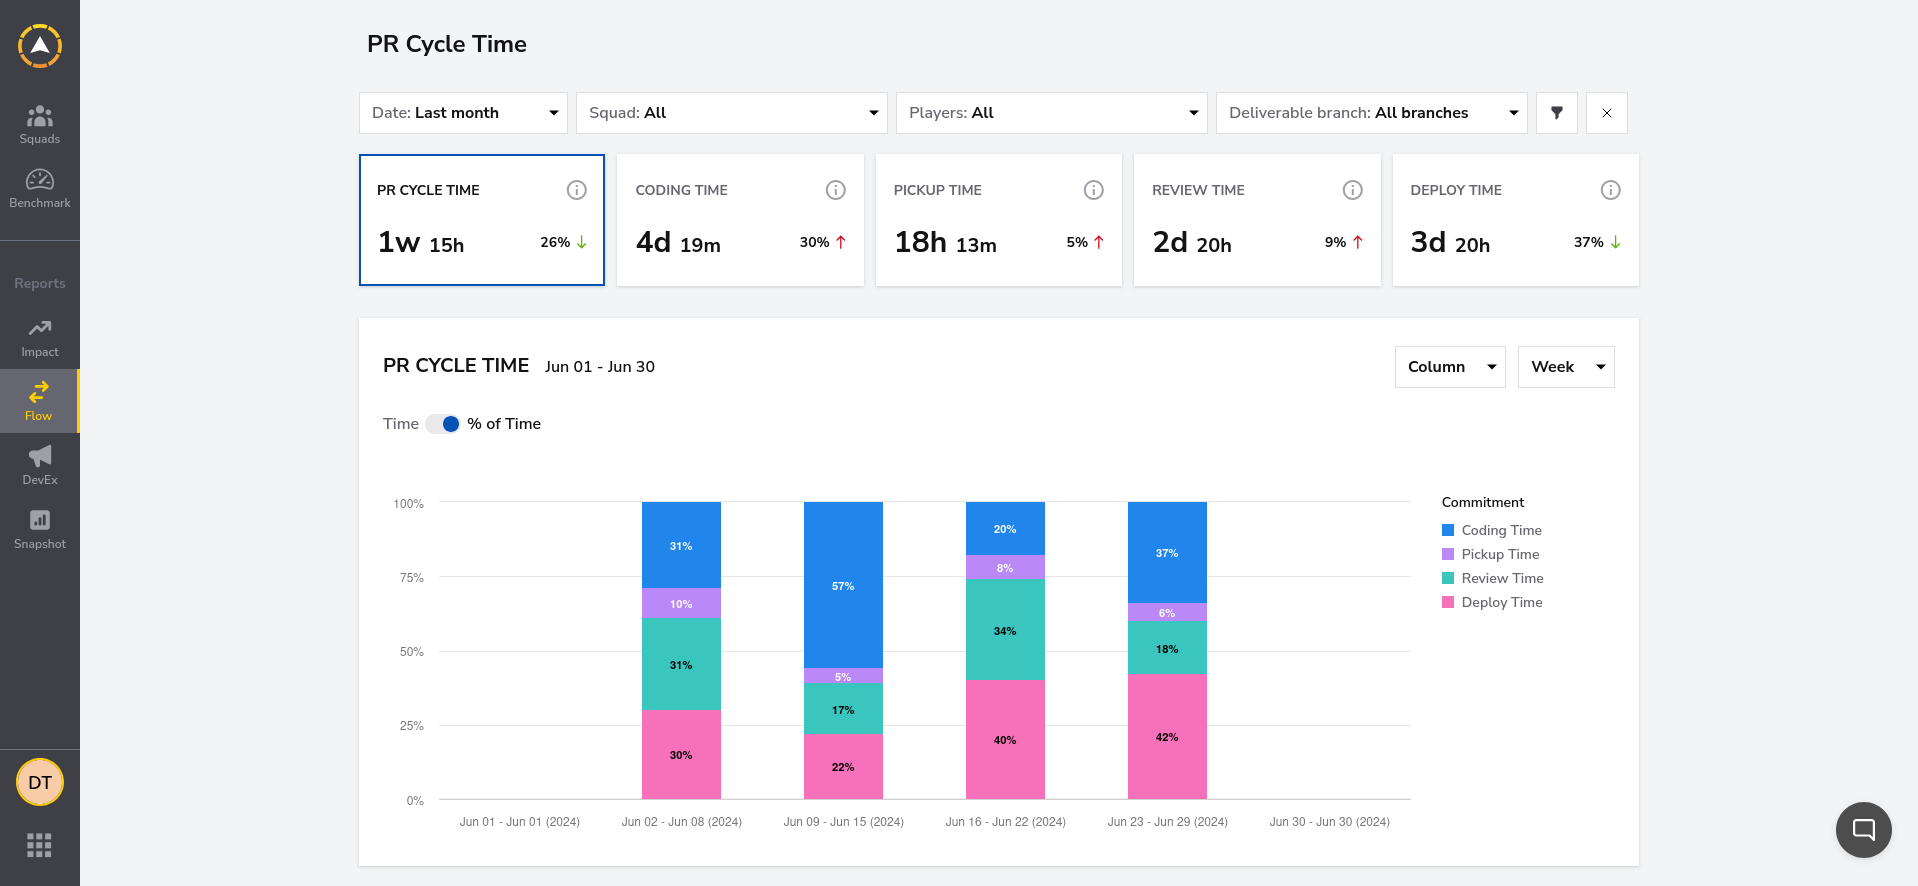
By default, DevStats overlays the graph with the exact time being recorded in each stage, such as "2w 1d" or "4d 18h". Flipping the toggle under the chart's title lets you change this to display the percentage of time instead, such as "31%" or "10%", which can be a more helpful metric if you're trying to check whether stage-level cycle proportions remain constant as the report time frame varies.
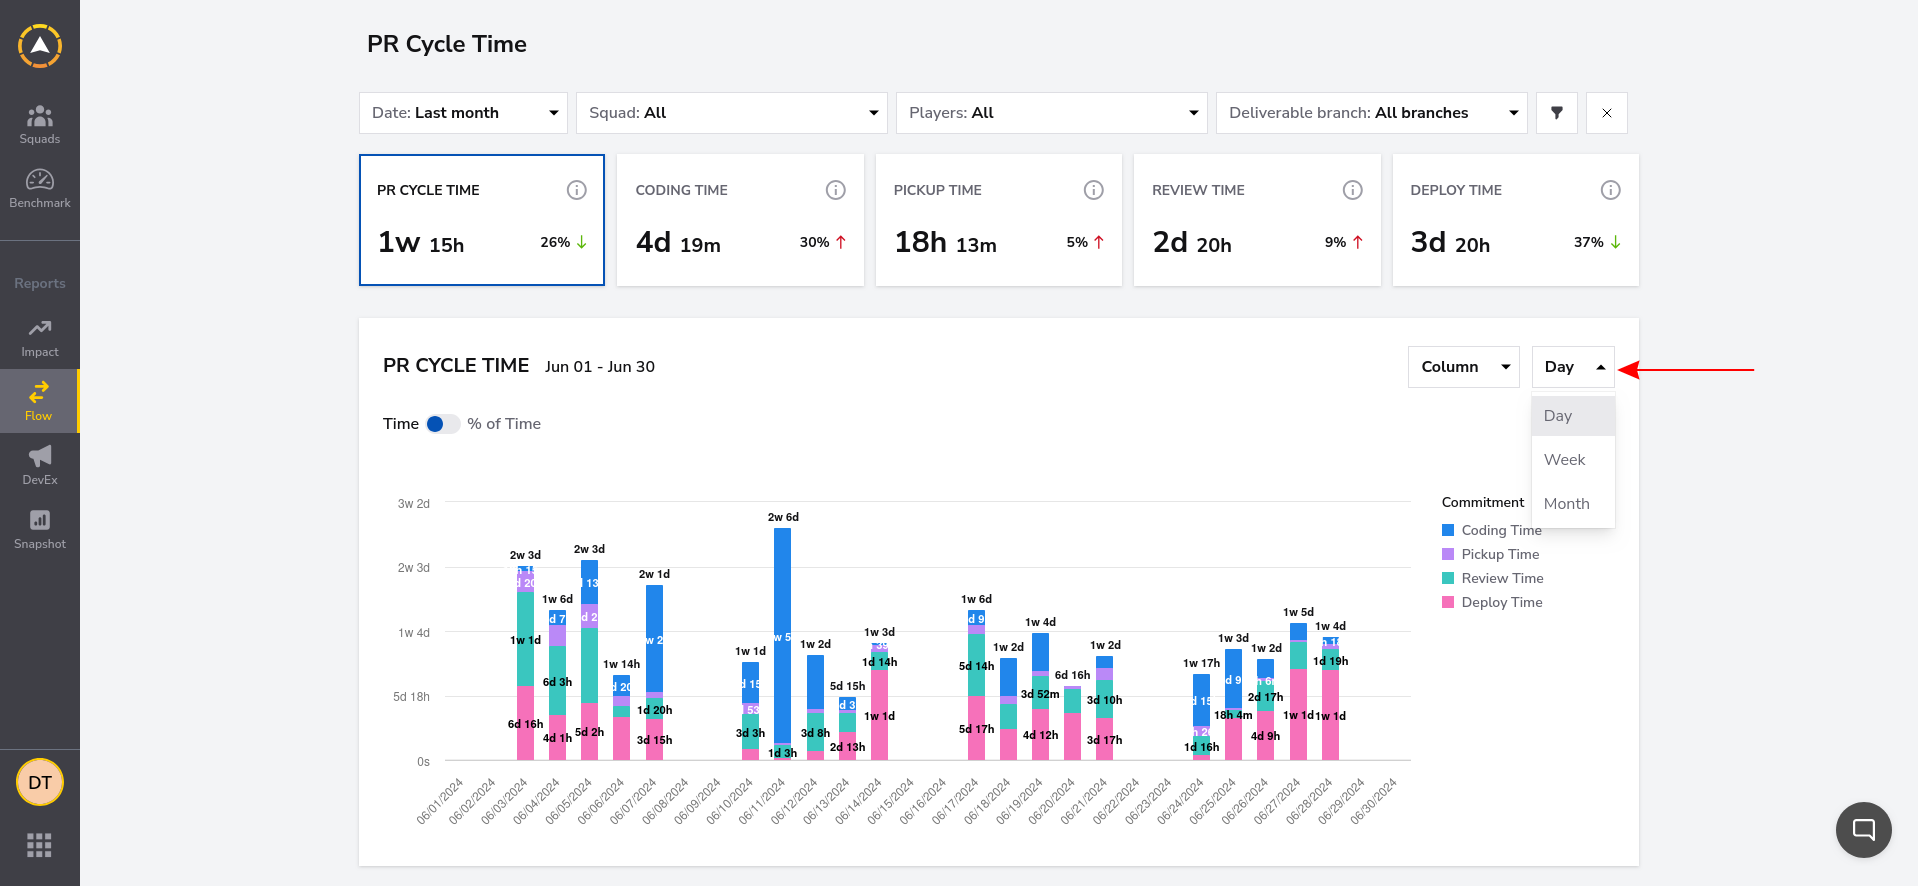
You can adjust the chart's view to break down the cycle time data by day, week, or month, allowing you to spot different patterns in how your cycles are evolving:
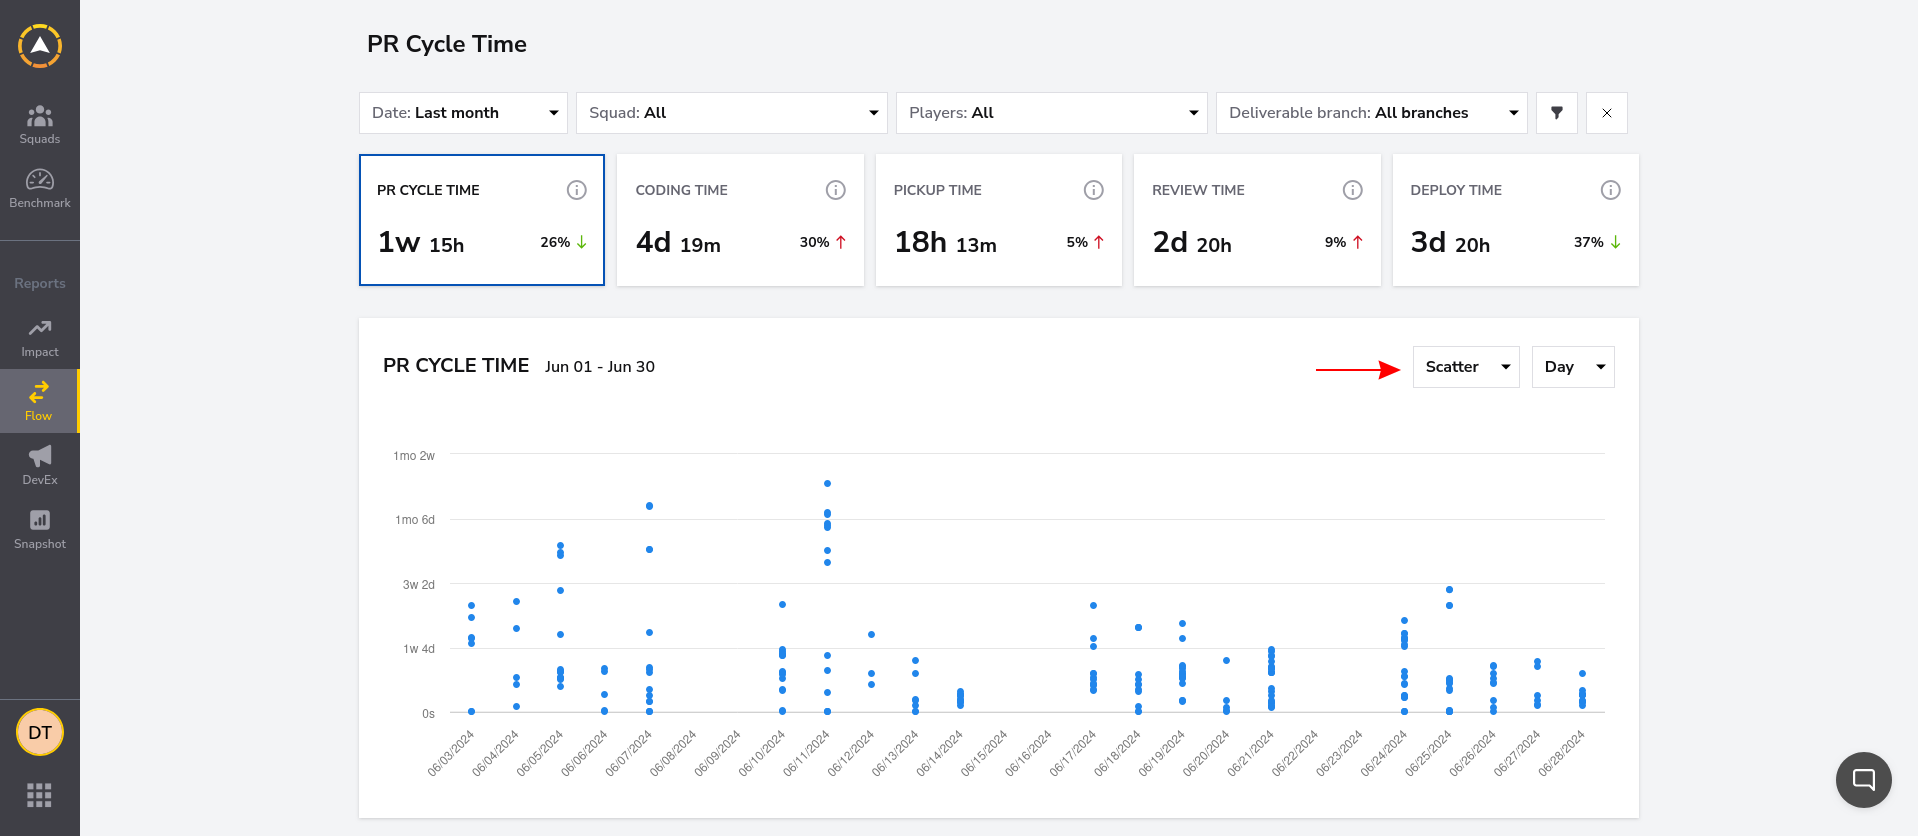
The bar chart can also be changed to a scatter plot that helps visualize the cycle time values associated with specific pull requests:
As you scroll further down the page, DevStats provides a tabulated breakdown of the cycle times recorded for the pull requests included in the report. You can evaluate your cycle durations on a per-feature basis, letting you see exactly how much time each work item is taking. This can help you determine whether individual features are being delivered within the time frame you estimated.
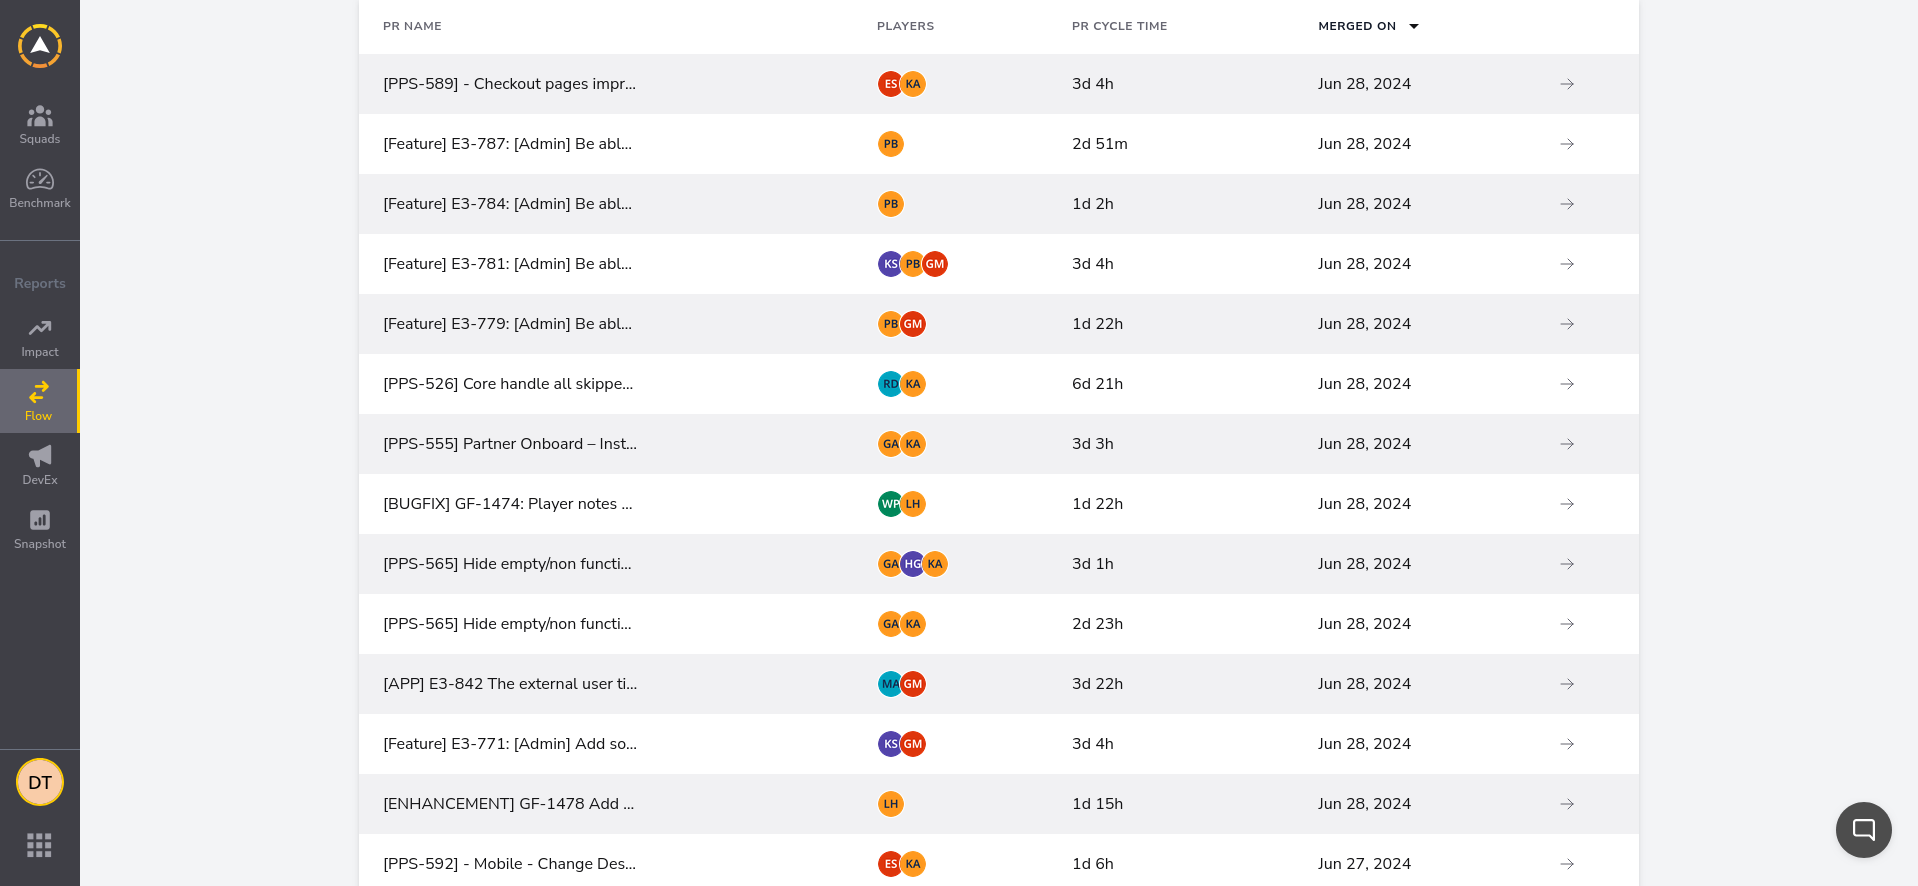
Identifying Bottlenecks in Development Stages
You can identify bottlenecks in development stages using the bar chart view to compare how the cycle times for each stage are changing over time. When your SDLC is running smoothly, you should see that the time spent in each stage remains fairly consistent. If a stage's cycle duration is increasing or strange outliers occur, a bottleneck could be occurring.
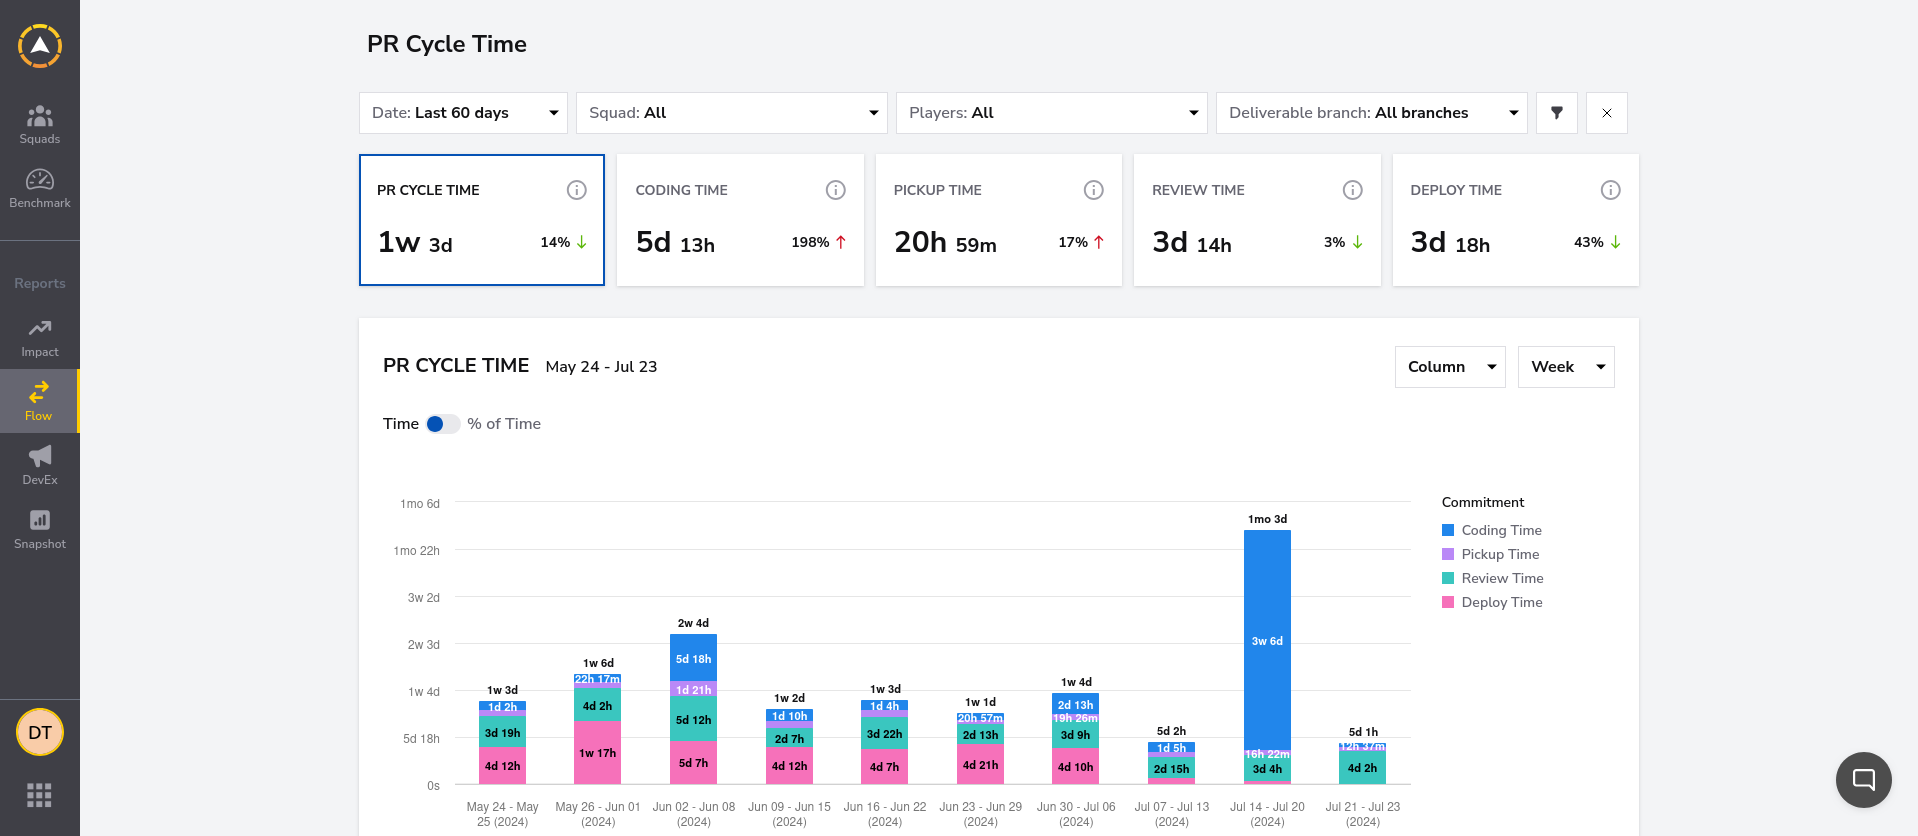
This report shows a potential anomaly in the week of July 14 to July 20. Coding time is much higher than normal, while pickup time and review time are relatively unchanged. It may be that developers were simply more productive that week and completed more tasks than usual, but the coding time increase could also be due to unusually slow progress because of a blockage.
Comparing Cycle Times for Different Work Types
You can filter the DevStats cycle time report to focus on a specific work type. First, click the filter icon on the right side of the top toolbar, then use the **Issue Type** dropdown to select the work type to view. You can choose from Bug, Enhancement, Feature, Hotfix, and Other.
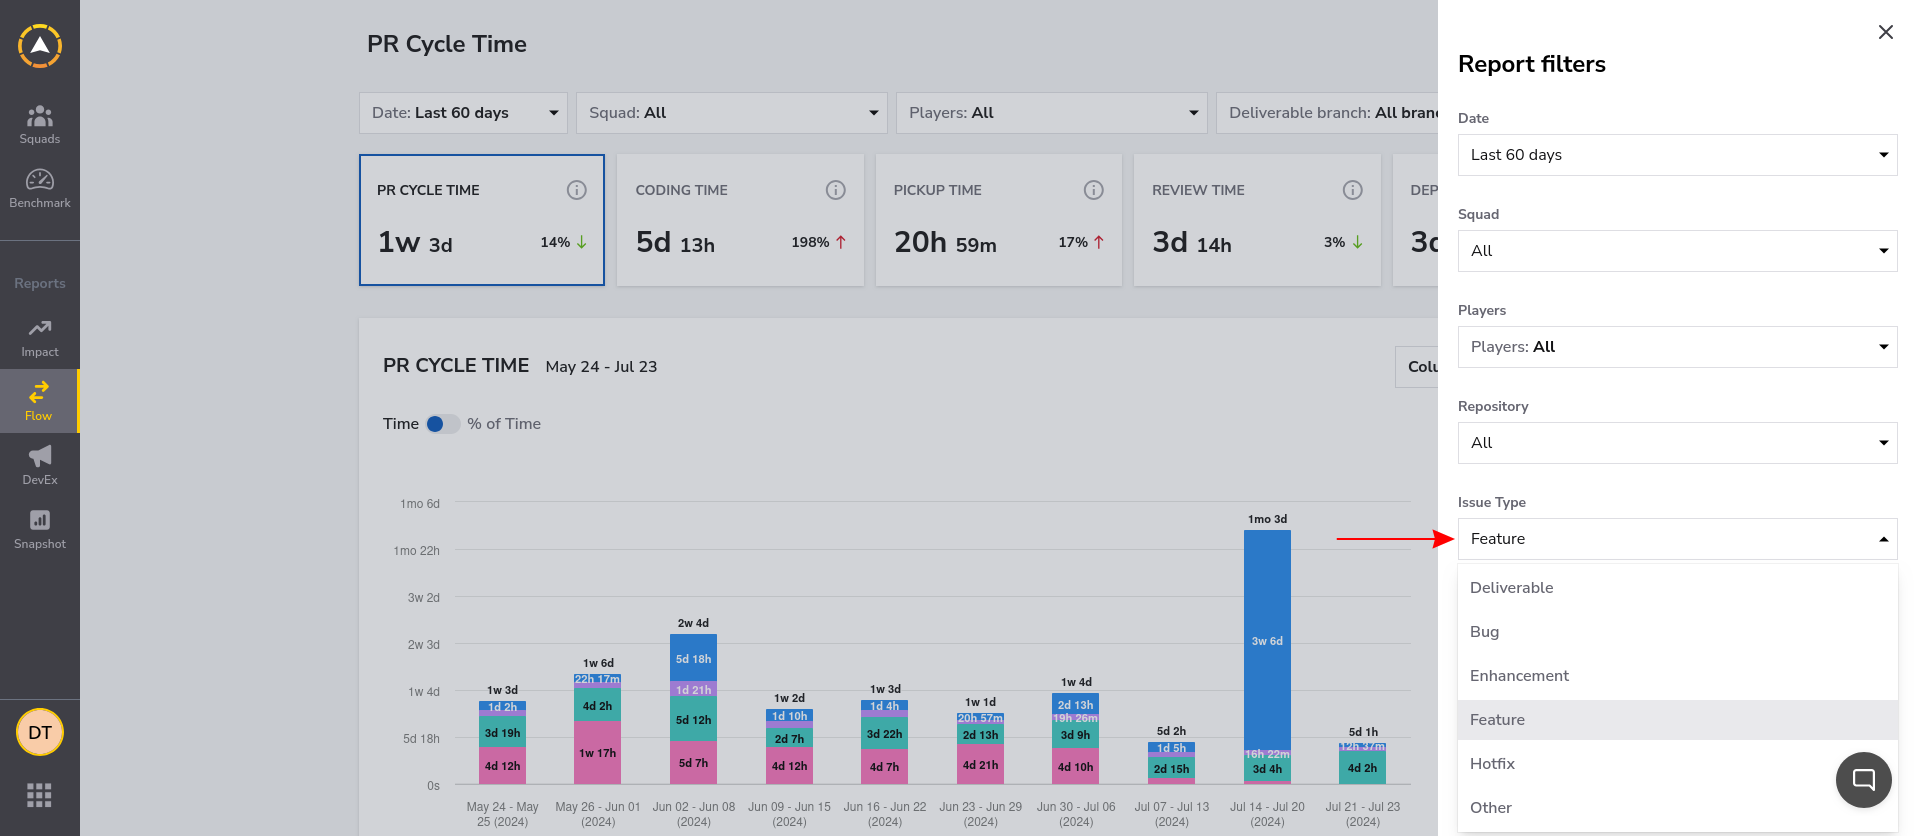
Filtering to a work type makes the cycle time report more accurate by removing outliers: if you're trying to shorten the length of your feature development cycles, then it's unhelpful if other types of PR are included too. Tasks such as bugs and hotfixes often have much shorter cycles than features, pulling down your average value. As a result, a high-level cycle time report could suggest you're delivering features more quickly than you actually are.
Comparing Cycle Times for Different Teams
The Squad dropdown in the top toolbar lets you view the cycle time data for specific teams:
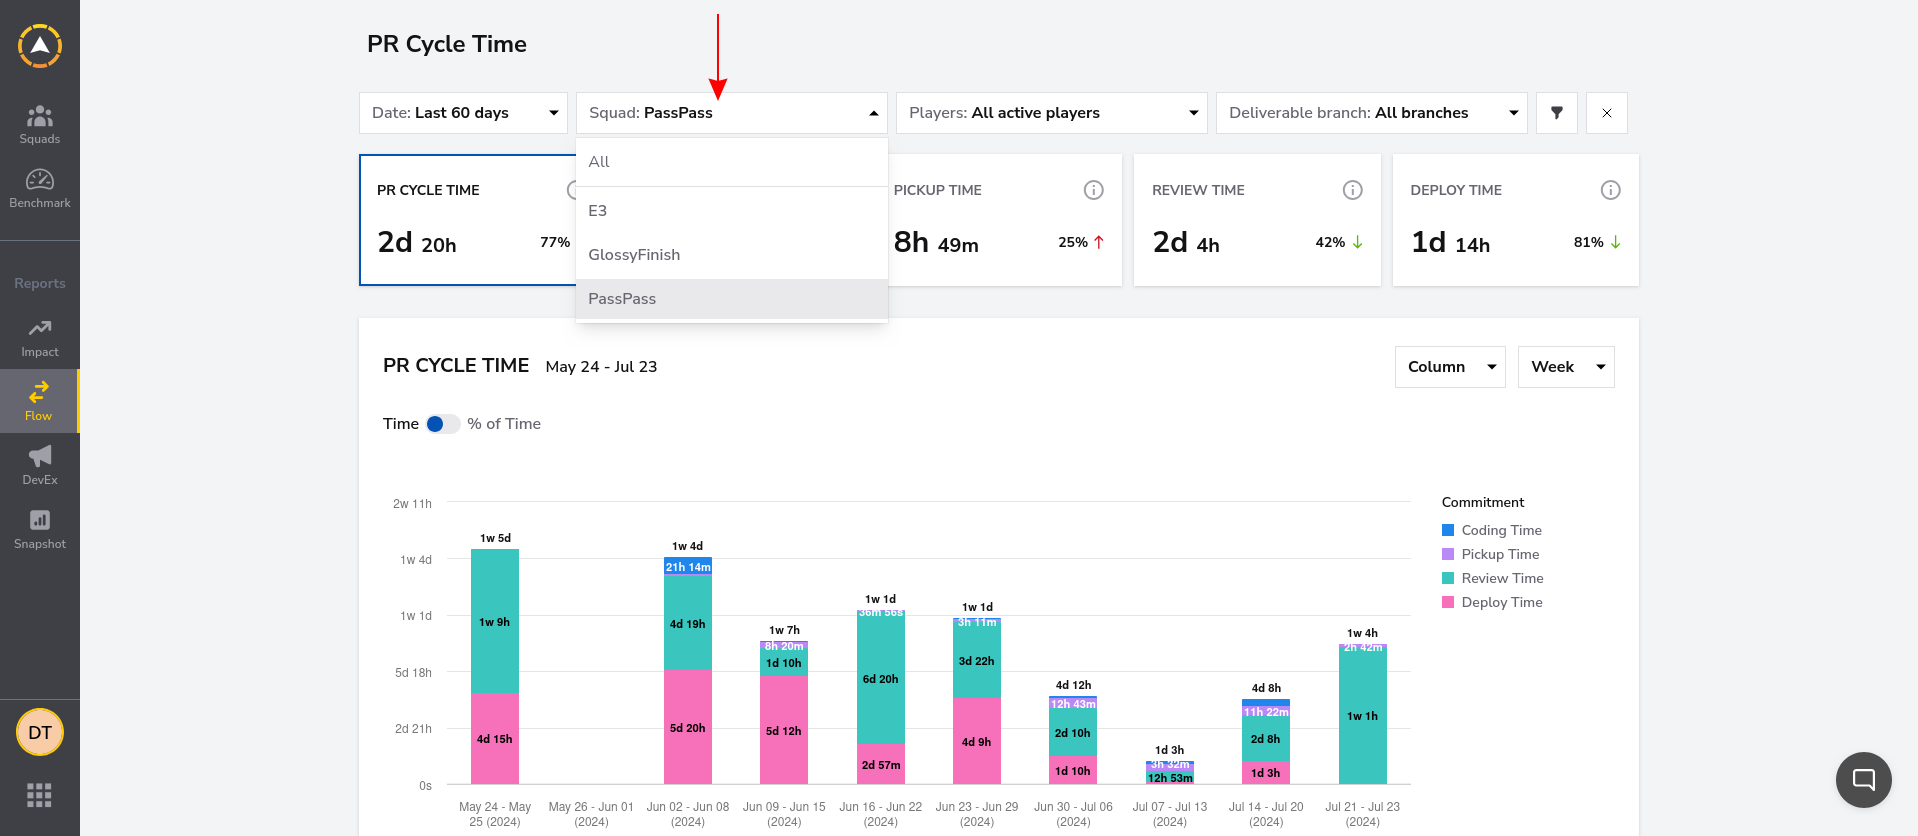
Comparing cycle time values between teams can reveal which groups might need more support to improve their throughput, as well as those that are already performing well. You can then take steps like implementing tighter interteam communication loops to ensure optimizations are shared widely in your organization.
Analyzing Trends Over Time
The ability to track improvements and regressions over time is one of the simplest but most vital features of a cycle time report. DevStats provides a wide array of options, via the dropdown in the top left—this includes popular prepared ranges such as Today, This Month, Last Quarter, and Last 90 Days, in addition to a custom date facility that lets you view an arbitrary time frame.
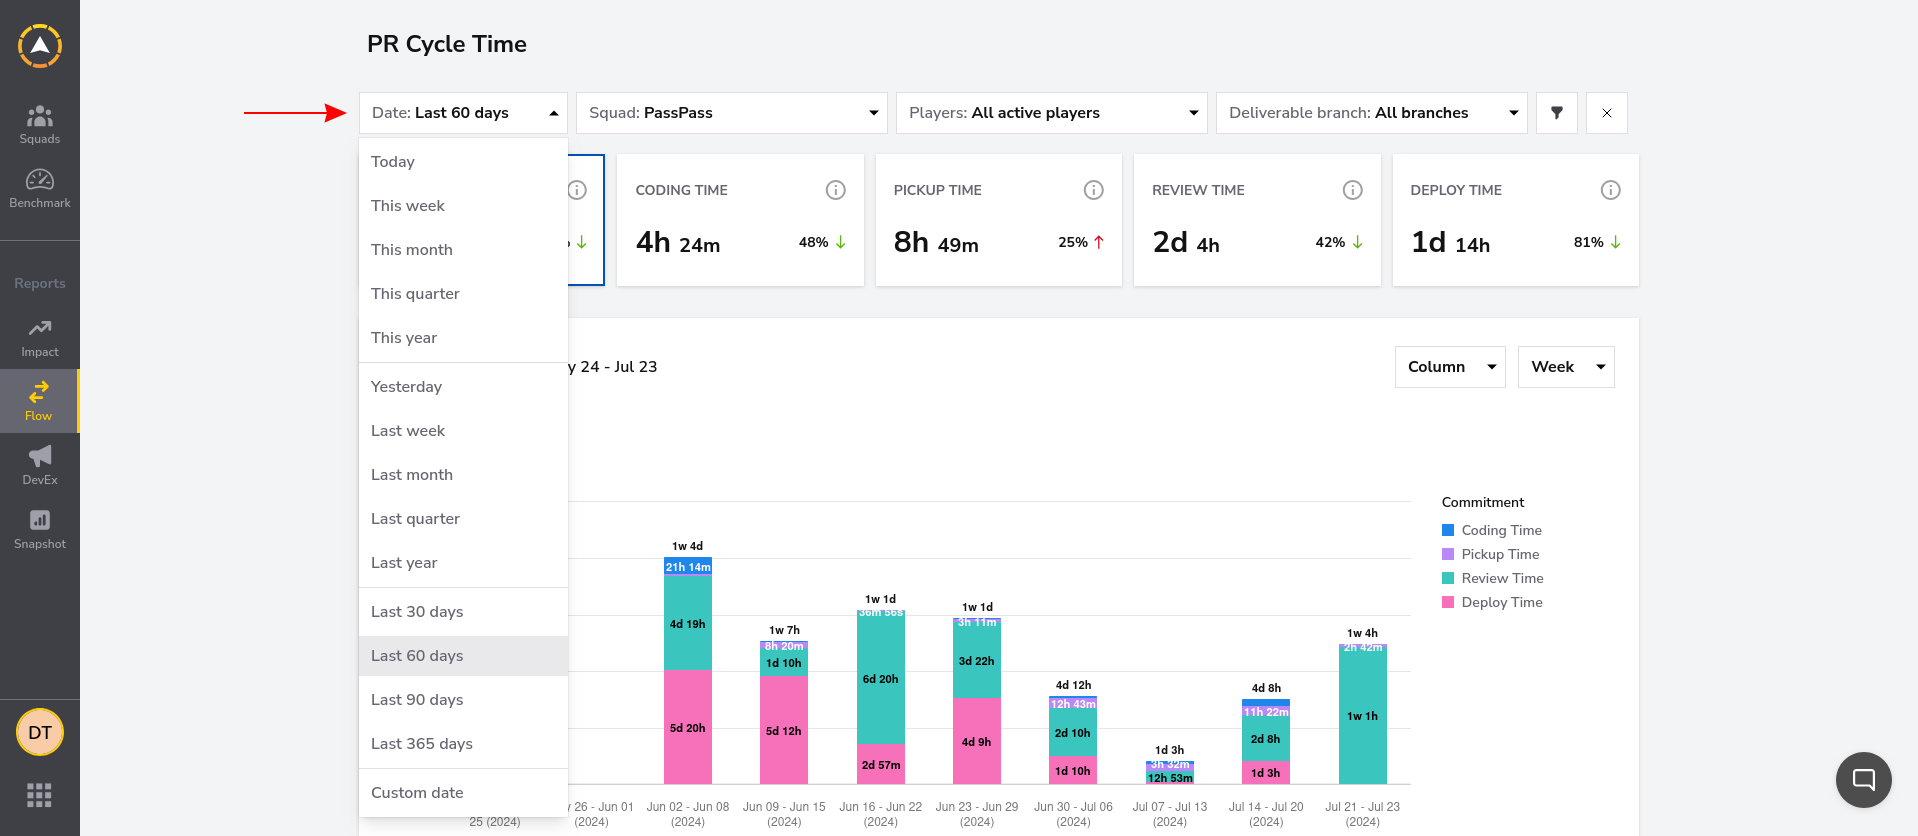
Generating a report over an extended period is the best way to monitor cycle time. This allows you to identify whether changes are real trends or merely short-term fluctuations associated with individual tasks. It's normal for cycle time to vary—some changes will inevitably take longer to deliver than others—but the long-term range should remain fairly consistent.
Utilizing Cycle Time Reports
Cycle time reports should be approached as actionable aids that help you design improvements to your development processes. Here are some of the ways in which you can utilize cycle time data to optimize your SDLC.
Identify Areas for Optimization Based on Bottlenecks
Development stages with long cycle times may contain bottlenecks that would improve engineer productivity if removed. Cycle time reports let you identify periods where cycle durations are increasing for a particular stage or work type, possibly signaling that tooling problems, team issues, or unsustainable workload pressures are affecting your SDLC. This helps you target optimizations to the areas that need them most.
Set Cycle Time Reduction Targets for Continuous Improvement
Shorter iterative cycles are more efficient, but it's not always easy to reduce the cycle lengths of existing teams and projects. Analyzing cycle time reports allows you to set realistic reduction targets that you can gradually lower over time while accounting for historical performance trends.
Track Progress Towards Faster Deployments and Improved Delivery Performance
Once your targets have been set, cycle time reports provide valuable progress tracking that permits developers and project managers to understand how delivery performance is evolving. Measuring how new tools and processes improve deployment throughput lets you check you're on the right course while providing additional feedback to devs, improving their motivation and sense of fulfillment.
Compare Teams and Projects to Gauge Which Methods Work
Cycle time reports highlight the teams and projects that have achieved the shortest cycle durations, indicating they may be working more productively than their peers. You can use these insights to compare which delivery methods are the most effective, then encourage cross-team collaboration to ensure improvements developed by individual groups can also benefit your broader project inventory.
Conclusion
In this article, you learned about the importance of SDLC cycle time and how to analyze it using visual reports from tools such as [DevStats](https://www.devstats.com). This information equips you to increase delivery velocity by identifying where cycle lengths are increasing, a key signal that development efficiency is suffering.
Although cycle time isn't the only DevOps metric that matters—it's important to assess overall team performance holistically by also considering other benchmarks, such as [DORA values](https://dora.dev)—it's a good starting point that conveys the responsiveness of your development process. A cycle time report also lets you see which tasks are occupying developer time, directing you to the most impactful optimizations in specific SDLC stages, such as coding, testing, and code review.
