Performance
See exactly how well your team is accomplishing work using DORA Metrics, output, and more.


Data Sets

Sprints
Understand the work contents of every sprint and plan better.

Deploy
Get insight on your team’s deployment frequency, totals, and change failure rates.

Investment Profile
Effectively communicate with stakeholders and show exactly what your team was working on.
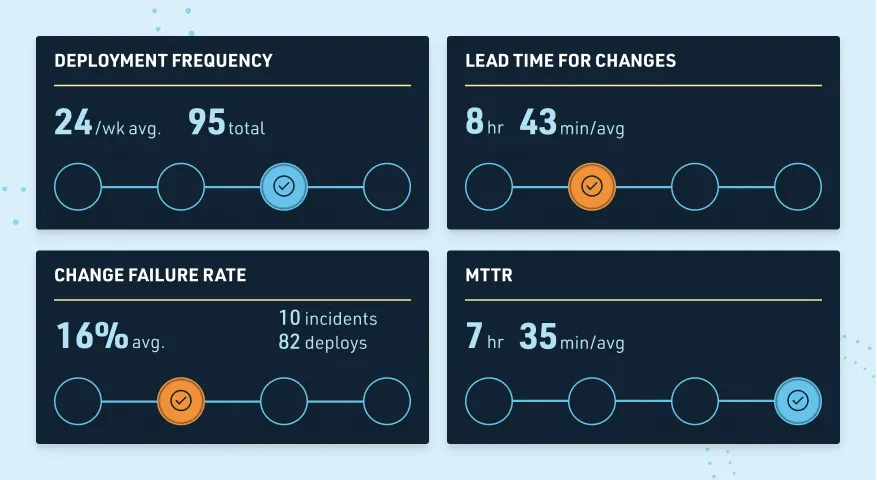
DORA Metrics
See how well your team’s performance stacks up with others using these industry standard metrics.
Direct integrations with
your go-to tech stack
Seamlessly connect your code repositories and communication tools to improve work quality.
Get a FREE, 6-Point Benchmark today.
You shouldn’t have to guess how well your team is performing. With DevStats, you can finally make improvements based on data.
See how your organization compares to others based on 6 key, industry metrics
Find areas where your dev team is crushing it and where you can improve
Increase your dev team’s ability to get shit done
No credit card required
