Ready to get started with DevStats?

No credit card required
Full access to all features
2 minute setup
How to calculate cycle time with GitHub and DevStats
By
Mdu Sibisi
12 Mar 2024
SHARE THIS POST
Cycle time is a key performance indicator (KPI) that measures the amount of time it takes to complete a repeating task, unit of work, or process chain. It could refer to the amount of time it takes to read a support ticket, review code, or complete the entire continuous integration cycle. Cycle time can provide you with insights that help to identify bottlenecks, optimize your team's efficiency, and deliver tighter project delivery timelines.
In most cases, you don't have to redo or replace your entire integration and delivery system. For instance, if you're already using GitHub for code management and integration, you can add a service like DevStats to produce cycle time reports for you. The following guide will show you how to integrate DevStats with GitHub and then produce cycle reports. You'll then be able to observe how cycle time can be a valuable metric in assessing the performance of your development and integration pipelines.
Calculating Cycle Time with GitHub and DevStats
First, you'll need to register for a DevStats account (if you don't already have one) and workspace domain, which will grant you access to its fourteen-day trial.
Upon successfully registering your account, you'll be redirected to the DevStats dashboard. Before you'll be able to integrate DevStats with GitHub, you will need to create a *squad*.
Creating Your First Squad
Squads represent your development team (or at least a subset of it). Essentially, squads allow you to define which users have access to your GitHub repository and must be monitored. Your squad can consist of a single user—you.
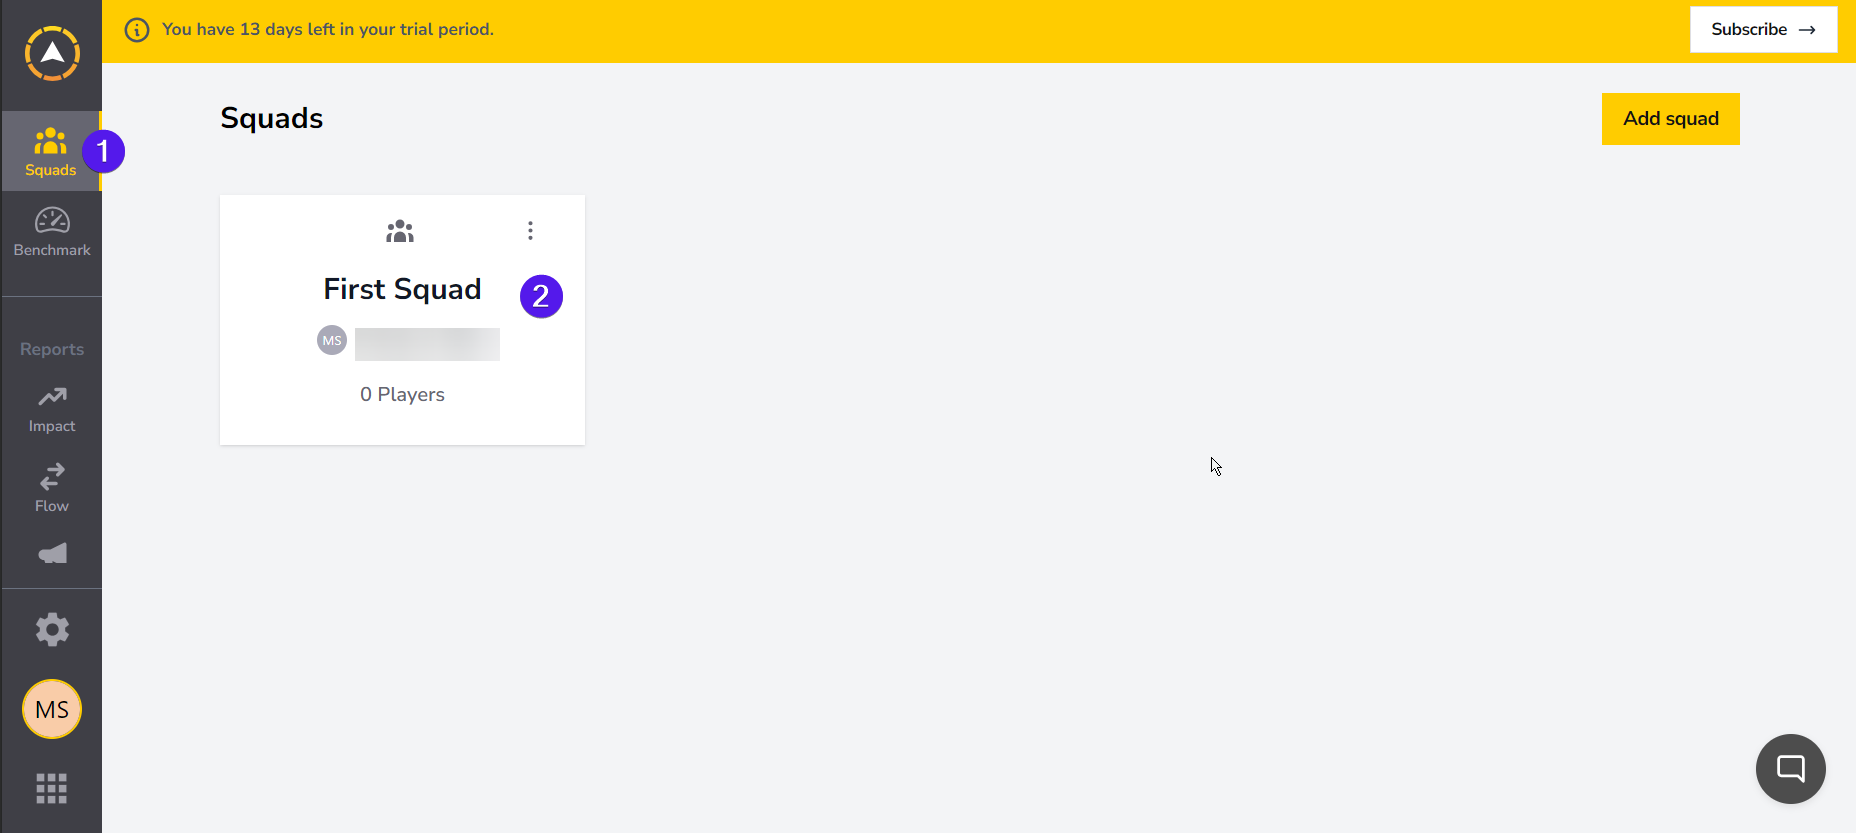
Once you're presented with the dashboard, make sure the Squads tab is selected and then click the Add first squad button.
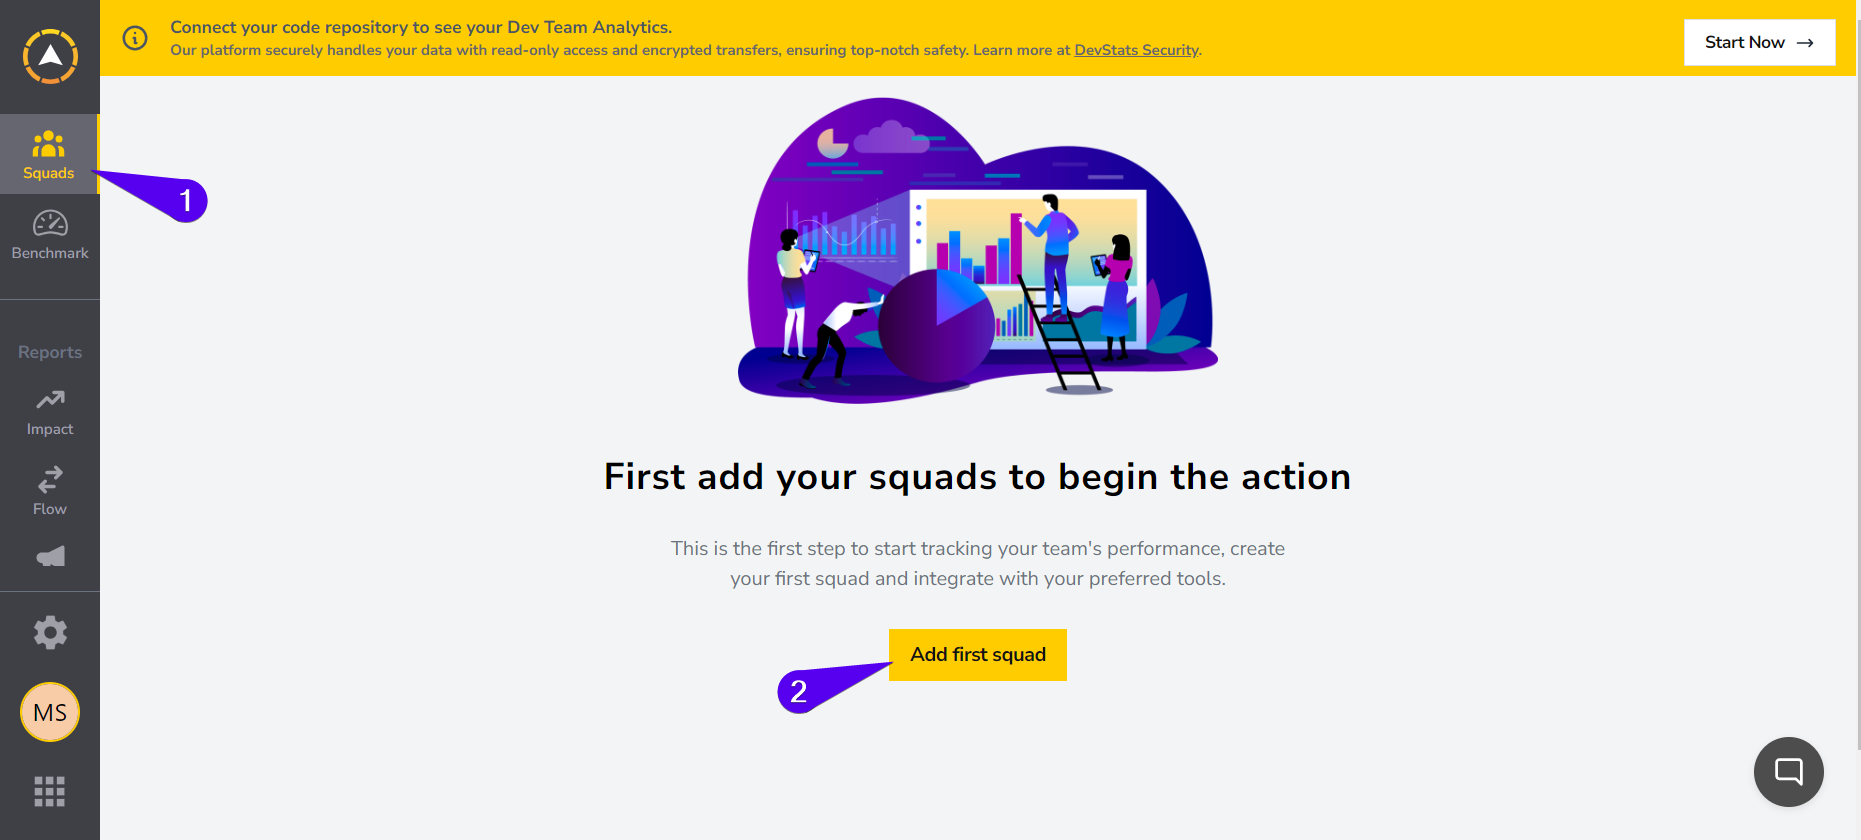
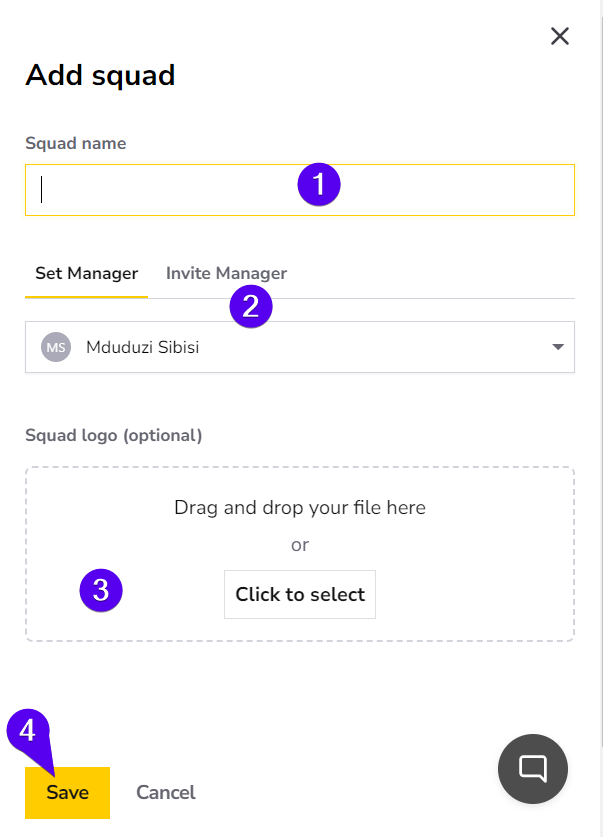
DevStats will then ask you to provide a squad name, manager, and logo. You can elect someone other than you to manage your squad. Adding a squad logo is optional. Once you've defined and configured your squad, click the Save button.
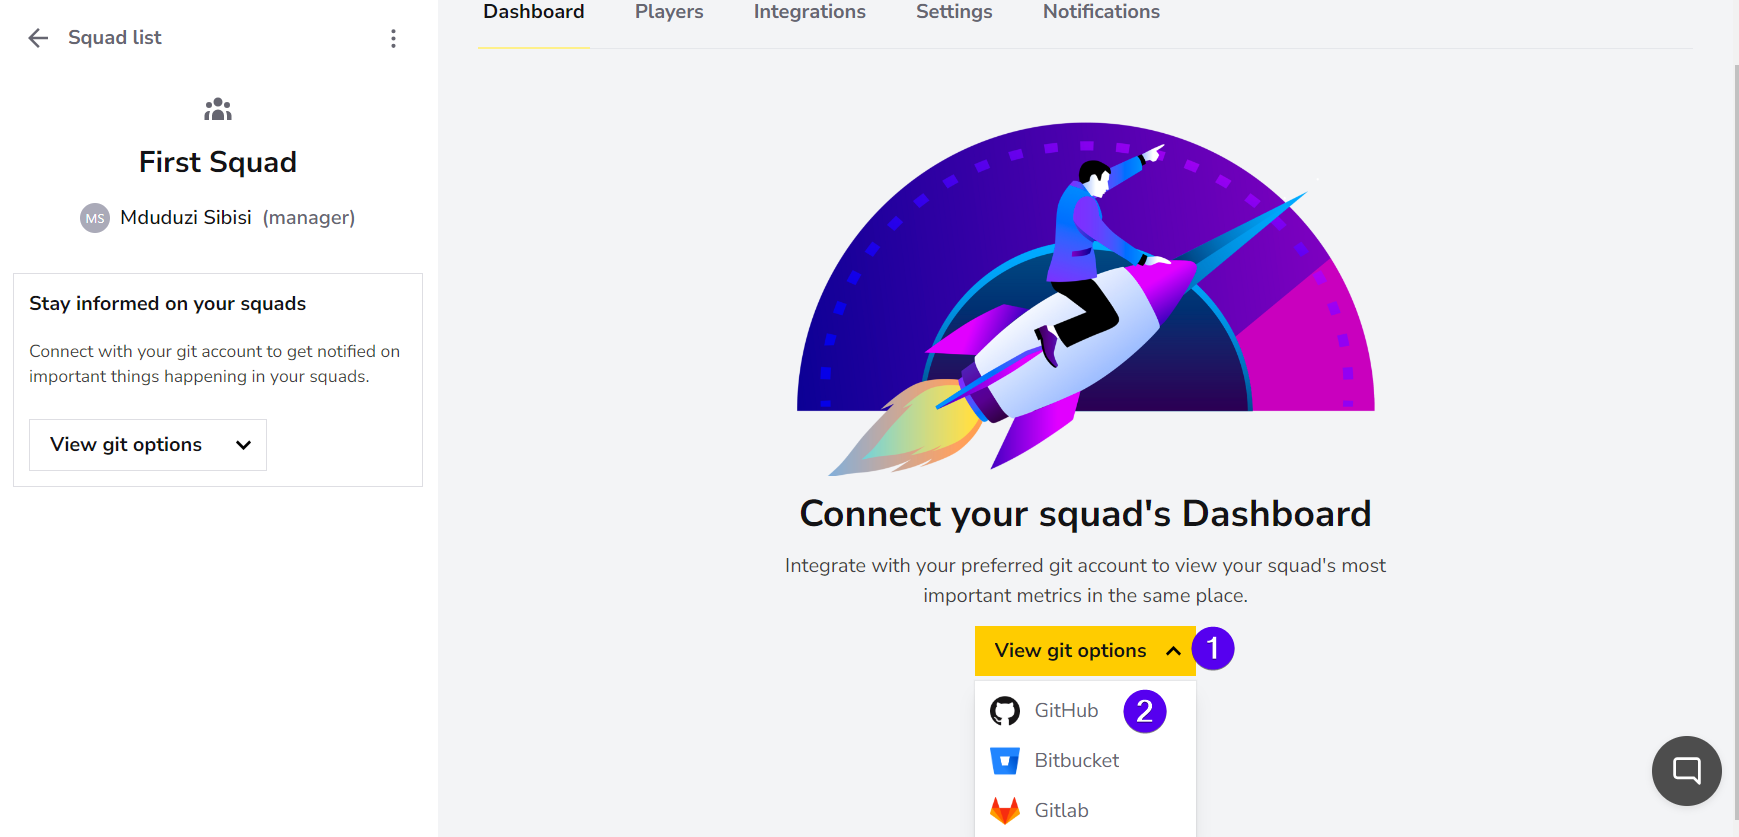
Now, you can connect GitHub to your DevStats squad.
Connecting GitHub to DevStats
Click View git options and then select GitHub from the drop-down menu.
Next, click Authenticate with GitHub.
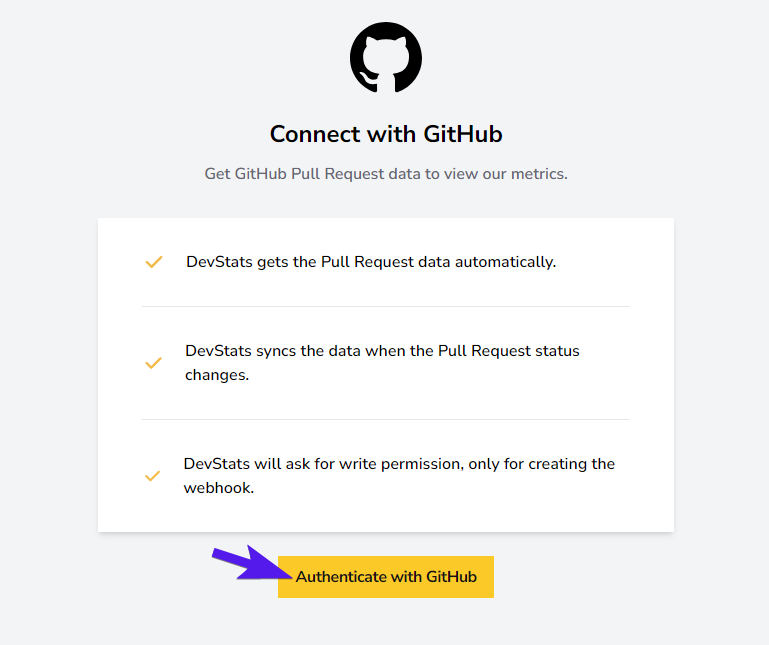
DevStats may redirect you to the GitHub login screen. In this case, enter your credentials and log in to your account.
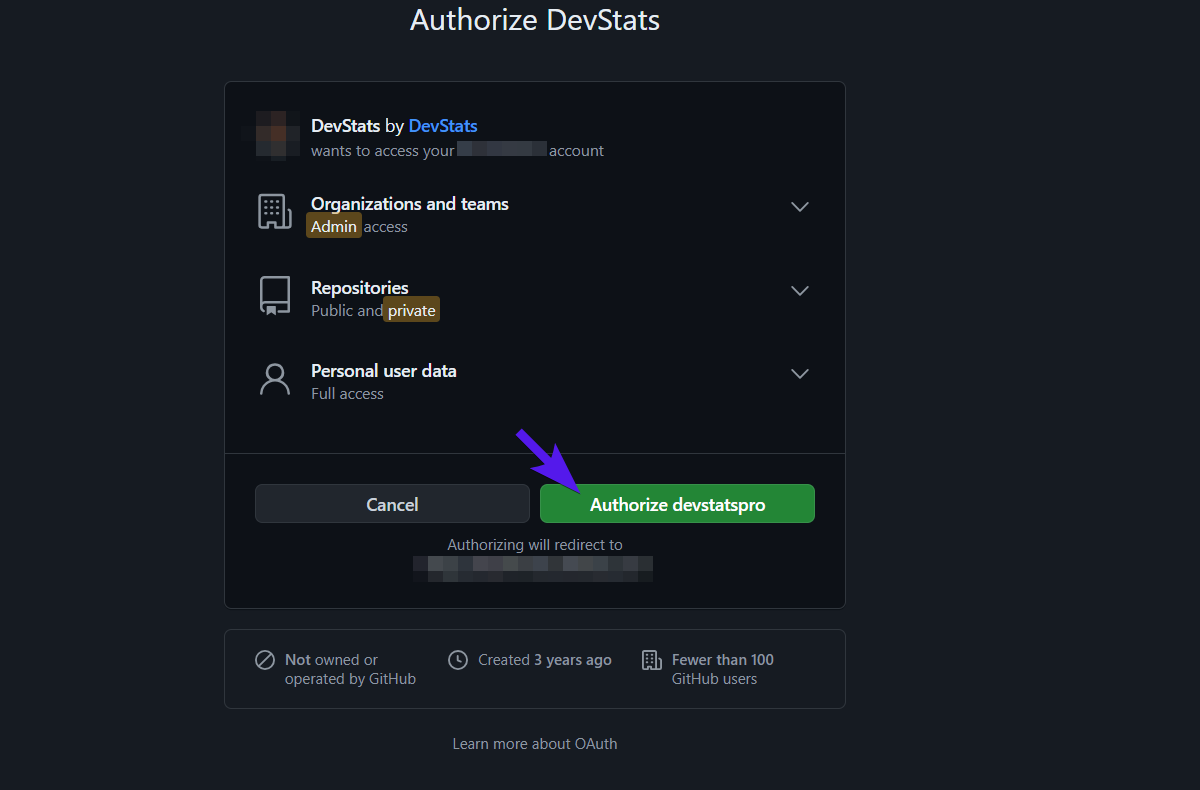
You'll then be asked to authorize DevStats. Make sure you read and understand the terms and conditions and then click the Authorize devstatspro button.
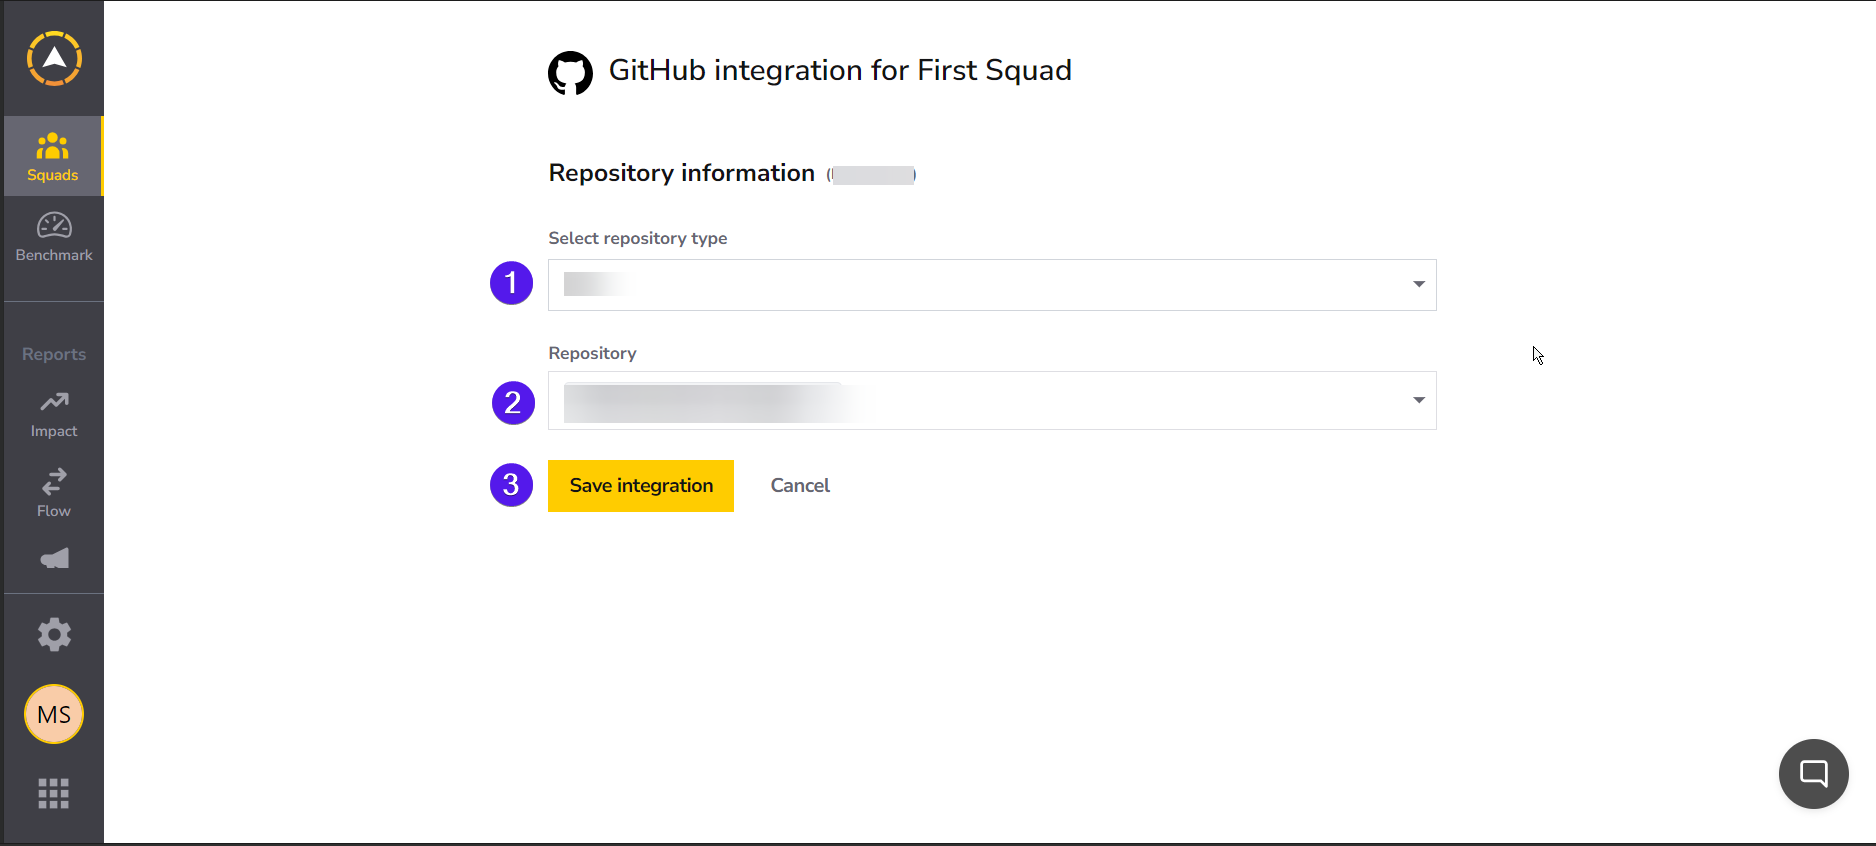
You'll be redirected to your DevStats workspace, where you'll be asked to select which repository you'd like to integrate DevStats with. Select your repository type and repository from the corresponding drop-down menus, then click on Save integration.
Note: You can select multiple repositories from the repository drop-down menu.
DevStats will begin processing your data. Once it's done, it should also send you an email informing you that your reports are ready to be reviewed.
How the DevStats GitHub Integration Works
DevStats cycle time measurements are primarily based on pull request (PR) data. Pull requests go through various stages, such as issued, opened/unopened, reviewed, and merged. DevStats measures the time your pull requests take to reach each stage. How efficiently your team handles pull requests translates to how productive it is.
DevStats automatically receives your repository's pull request (PR) data (after you've authorized it to do so). The service synchronizes your data using a webhook that is triggered anytime the status or stage of one of your project's pull requests changes. It uses this data to measure your project's PR cycle times, which represents (at least partly) your overall development and integration cycle times. Let's explore the DevStats dashboard and reports.
Understanding the DevStats Cycle Time Report
You can access your reports from your DevStats workspace by selecting the associated squad from your workstation.
You can filter the data from the dashboard according to the date (today, this week, this month, etc.), players (your team members), deliverable branch (all, develop, master, and main), and repository.
Managing Your Players
Players refers to anyone connected to your repository—mainly those who've made or worked with pull requests. You can import players from your repositories by clicking the Players tab and then clicking on the Manage Players button. This will reveal a panel with a list of players you can add (or remove).
Note: Your players may only appear after a pull request is initiated from one of your integrated repositories.
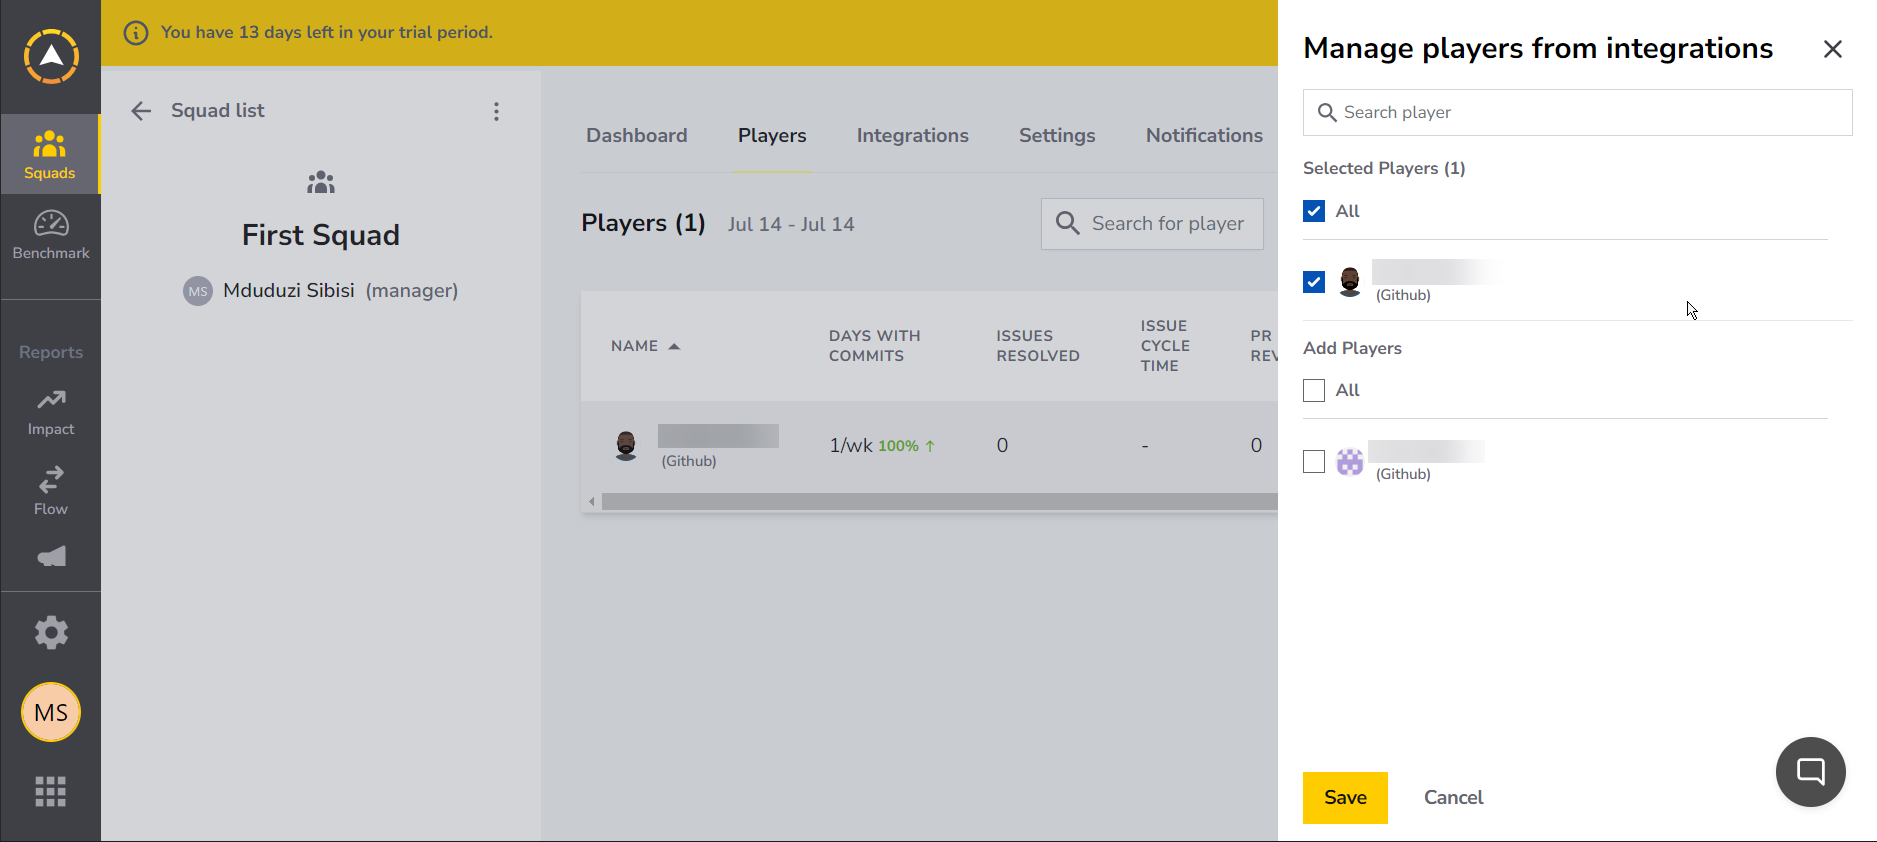
Once you've selected which players you'd like to include in your reports, you can click the Save button and return to the dashboard.
Exploring the Dashboard
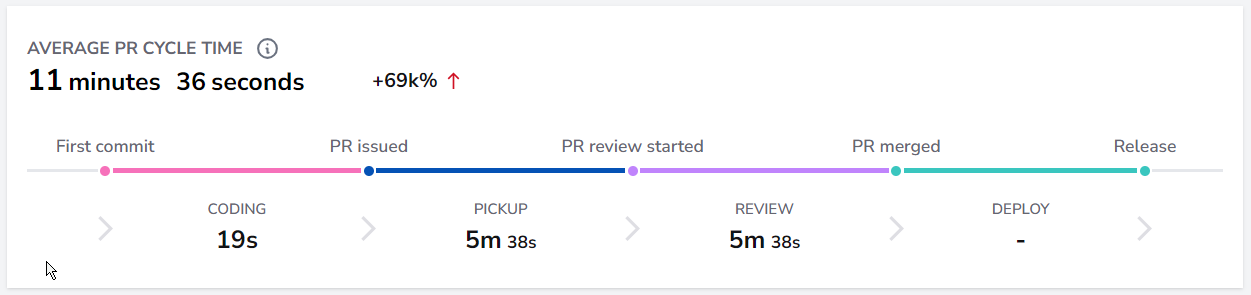
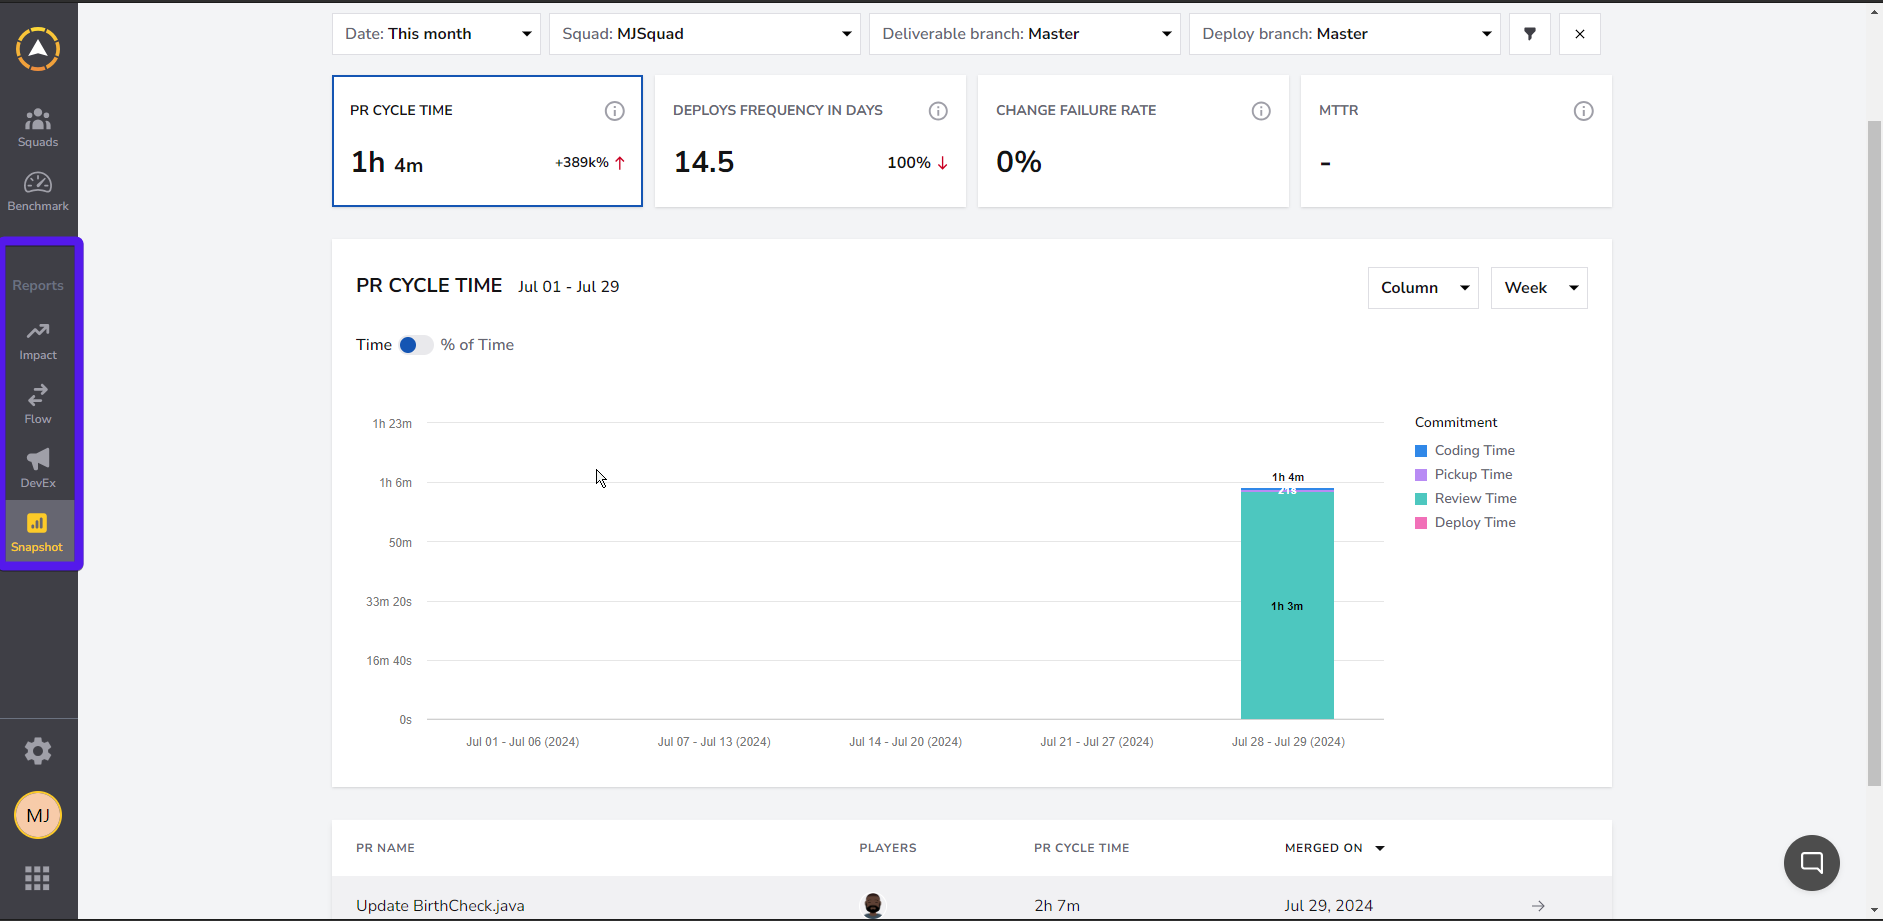
The first widget on the dashboard provides you with average cycle time statistics. In addition to the total average cycle time, the widget shows you the average cycle time of each PR stage according to the filters you've set.
The next widget you should pay attention to is work breakdown. This uses a pie chart to show you how much time your team spent on certain activities, mainly writing new code, refactoring, and reworking your project.
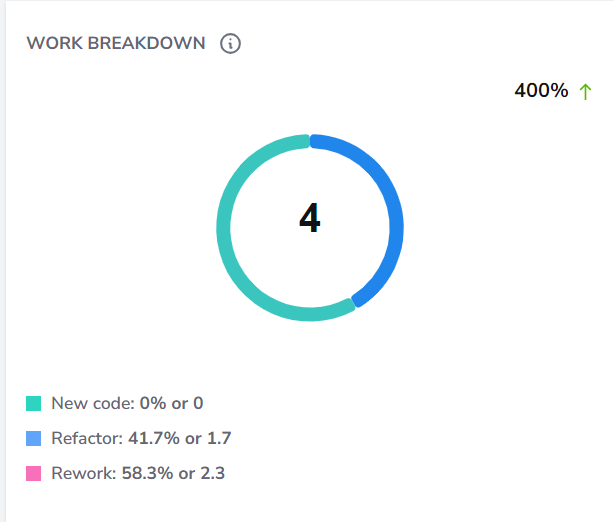
You can use this to determine how much time is being wasted or misallocated to certain stages of the development process. Does your team spend more time restructuring your projects when it should be working on new features? The work breakdown widget can help you understand this.
The next two widgets are code review size and deploys.

Code review size displays the average amount of code (in lines) that is reviewed weekly. You can use this to determine if your team is reviewing too much (or too little) code weekly. Likewise, deploys show you the weekly rate of deployments.
Directly underneath code review size and deploys, you'll find investment profile.
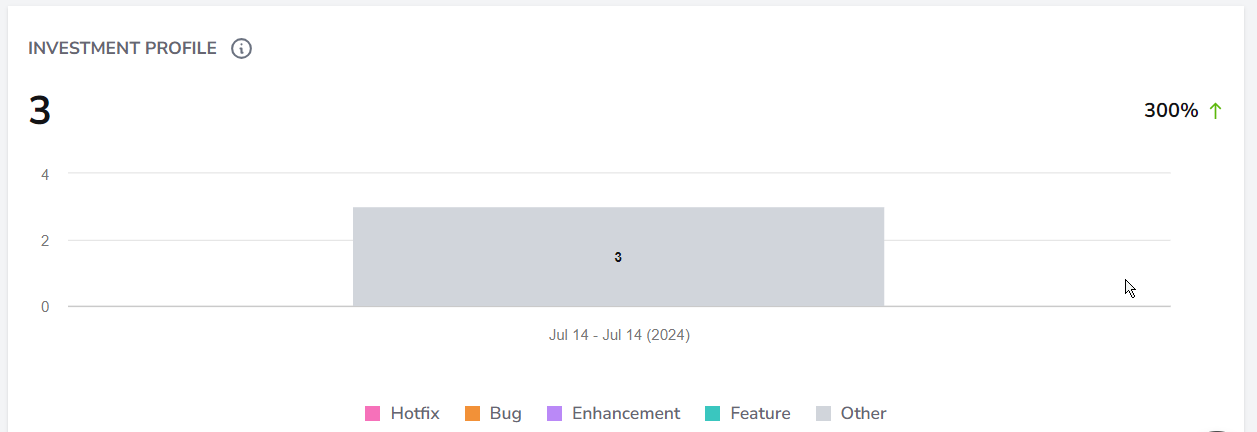
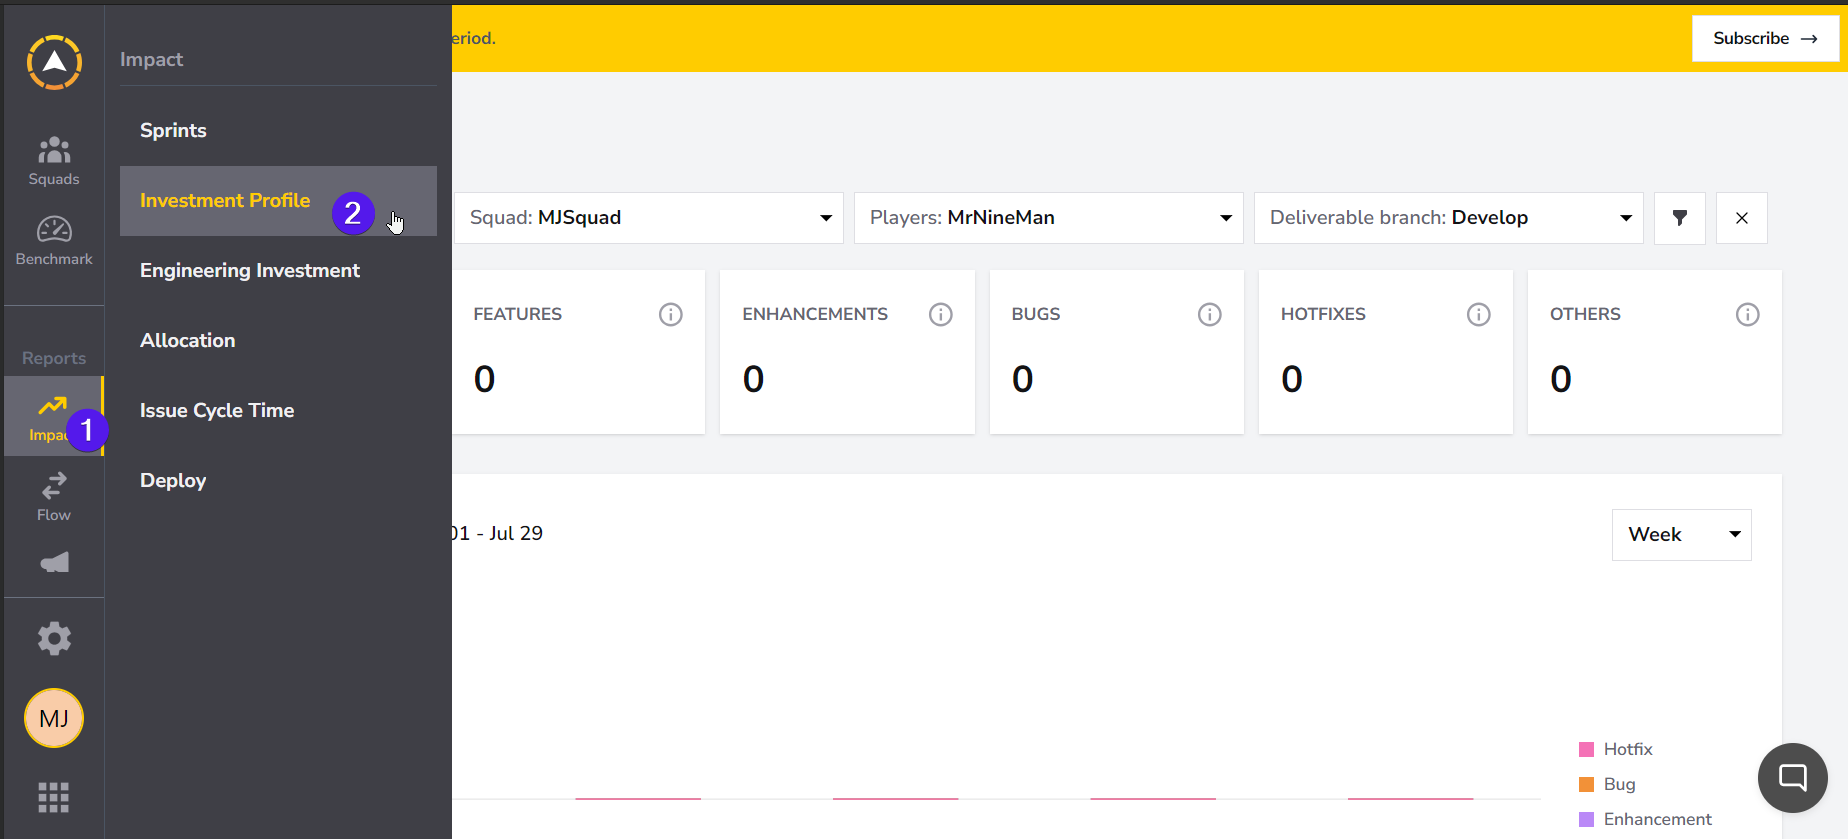
This visualizes the number of (closed) pull requests from a specified period. Similar to work breakdown, you can use it to determine the amount of time and/or effort your team dedicated to certain tasks. This also allows you to identify any outliers and potential bottlenecks—for instance, whether your team's time is being dedicated to unspecified tasks when it should be dedicated to adding enhancements.
One way to use this is to track how many hotfixes your team had to make and deploy in the last month. This can be used to deduce the efficacy of your team's code-testing and bug-detection practices. If the number of hotfixes goes beyond a threshold you've set, it can be a sign that you need to improve how your code is tested.
DevStats also features a dedicated Investment Profile screen that you can access by clicking the Impact tab, then selecting Investment Profile from the menu. It offers a more detailed and focused view of how your team allocates time and resources.
In addition to the above measurements and visualizations, you can view and export your team's cycle time statistics according to the player. You can access these features by clicking on the Players tab.
Viewing and Exporting Player Data
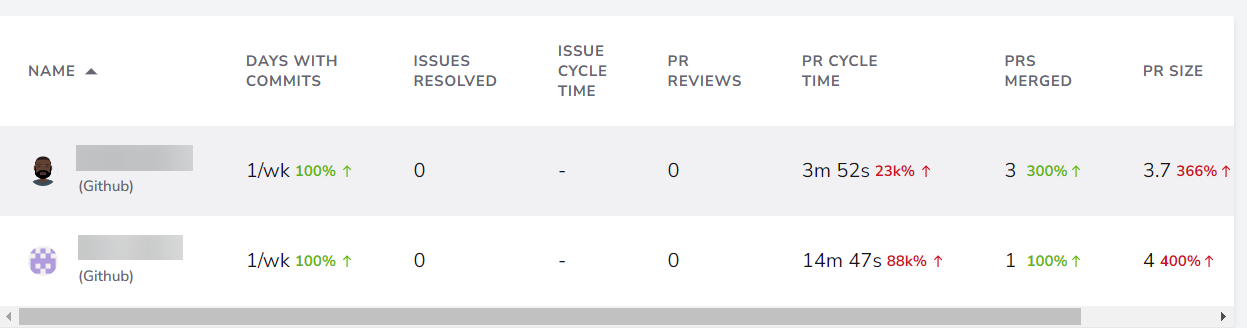
Statistics on this page can be filtered by date and player. The page also features a button that allows you to export player data as a CSV file. This ultimately allows you to export your cycle time reports for further analysis and presentation. Metrics in the export include the following:
- Number of days with commits: the number of days this player committed pull requests in a specified period (represented as a percentage)
- Issues resolved: the number of issues resolved in a specified period (represented as a total number)
- Issue cycle time: the amount of time spent on resolving issues
- PR reviews: the number of PR reviews completed by this player
- PR cycle time: the average PR cycle time (represented as hours, minutes, and seconds)
- PRs merged: the number of pull requests this player has merged
- PR size: the average code review size of each pull request this player has initiated
Many of the above measurements can be viewed on the main dashboard page. However, the Players tab provides you with a table, making it easier to compare stats between team members.
You can view more details about the player by clicking on the eye (👁) icon. You may need to completely scroll the table to the right before you can see or access it. You'll also find a kebab button. Clicking on it will bring up two player management options—Merge player and Remove from squad.
Advanced Player Details
The player-detail screen allows you to view information from one of two data sources—your Git provider (GitHub in this case) and your project management tool (such as Jira). In addition to the investment profile, the screen also features three exclusive widgets.
The language breakdown displays the language distribution of the projects the player has worked on. The contribution volume displays the amount of code revisions (additions and deletions) the player has committed. Activities by type allows you to visually analyze which activities a player focused on in a given period.
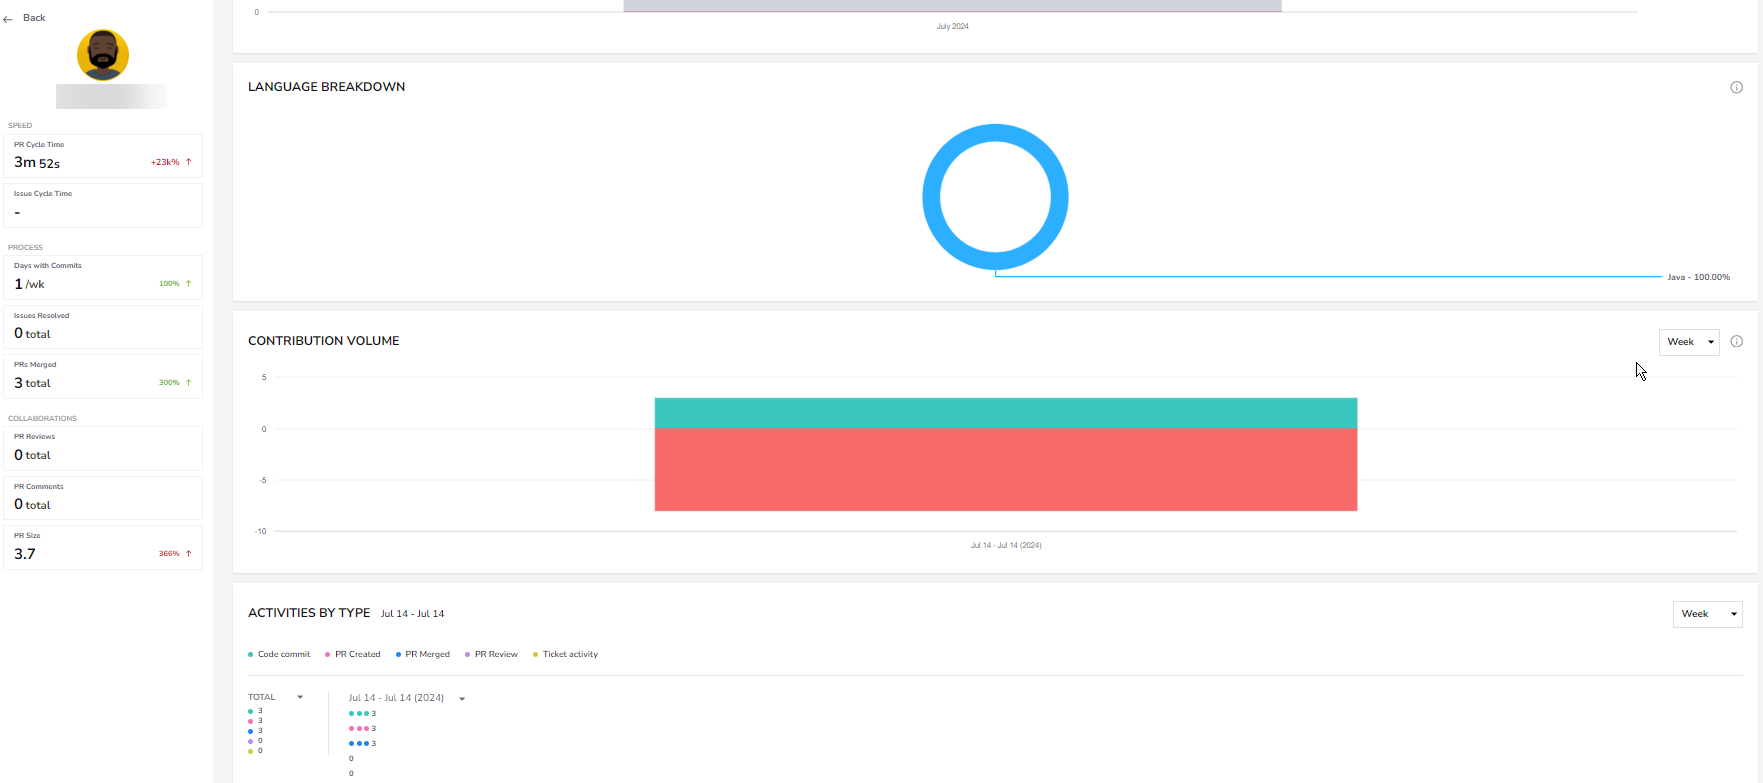
All of these metrics can be used to assess the productivity of not only your teammates or subordinates but yours too. For instance, you can use them to measure the amount of time you spend chasing dead ends. You can also use them to compare current productivity to past productivity. These insights can be especially valuable to developers looking to improve and measure their progress.
Benchmarks
If you're unsure what values to use to assess your team's cycle performance, the benchmark screen allows you to compare your cycle times and productivity against the DevStats averages. You can access this feature from the side menu.DevStats benchmarks
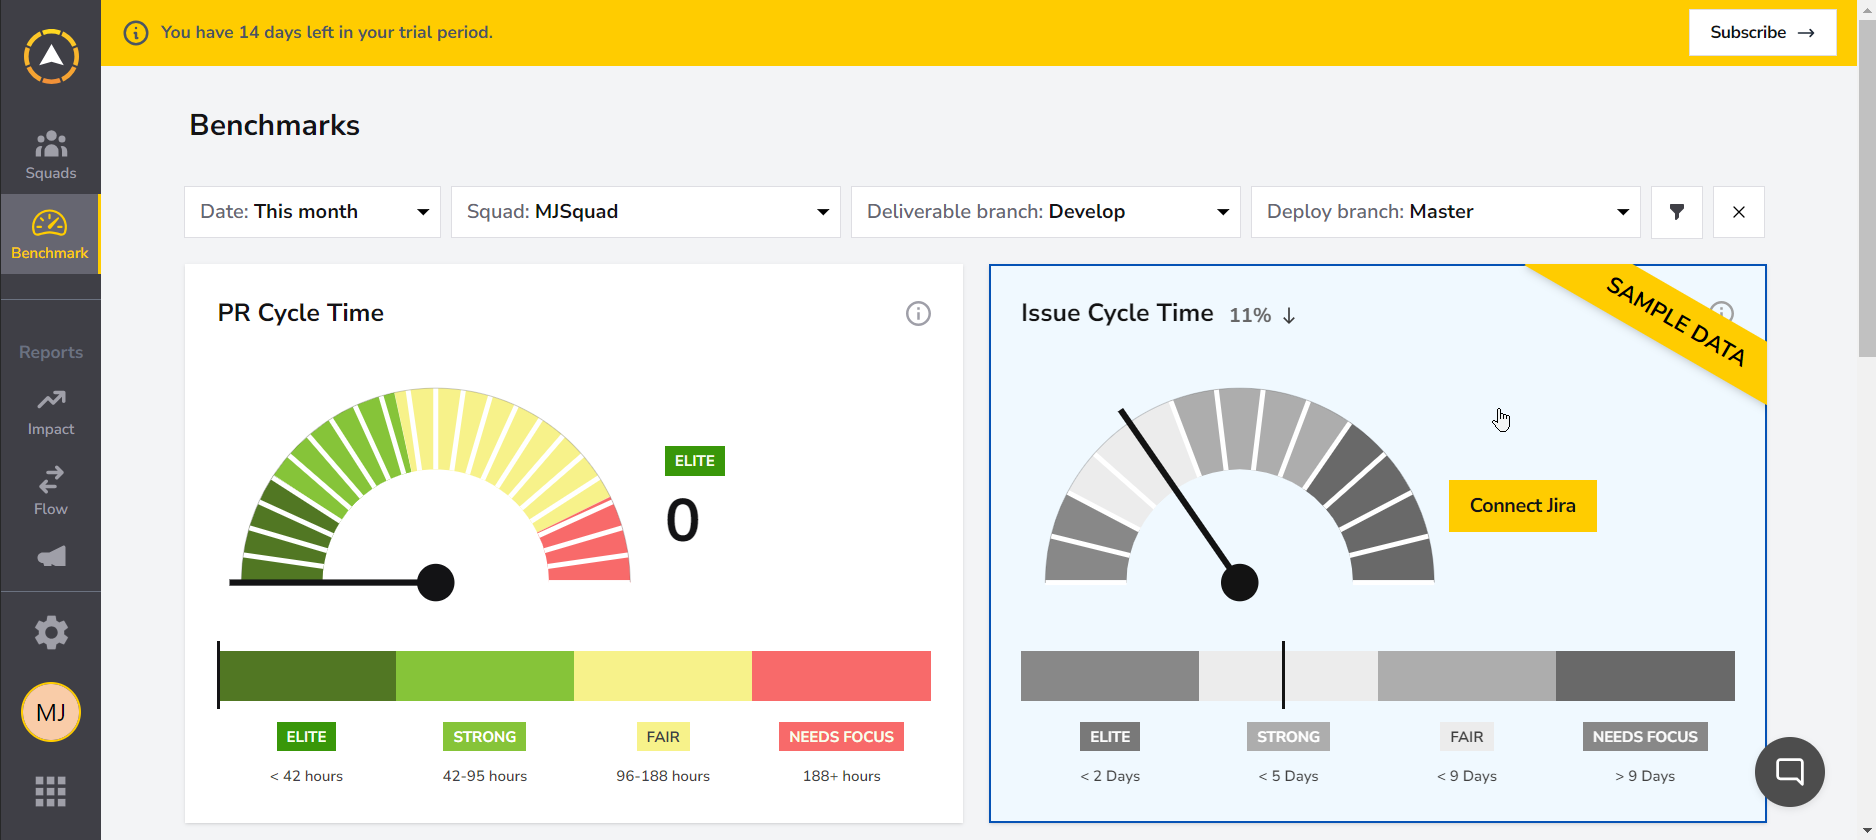
It features benchmarks for your PR cycle time, change failure rates, code review size, and deployment frequency, all visualized as meters and gauges. Connecting your Jira account to DevStats will also give you access to the issue cycle time and planning accuracy features.
As you monitor your team and project's cycle time, you may implement measures to help improve performance. Essentially, the benchmark feature allows you to compare your progress against industry standards. This will let you know if your team is actually performing as well as it should be. It also provides you with performance standards and goals you can aspire to.
Impact, Flow, and Other Advanced Features
The Reports section of the left menu bar allows you to access more detailed information about your cycle times and your team's productivity. You've already covered some of the tools (work breakdown, investment profile, deploy, etc.) in the previous sections.
The Impact section contains tools to help you track how much your process improvements have affected cycle times. It includes tools to measure your sprint cycle times, time and effort investment profile, task allocation, issue cycle time, and deployment information. You'll need to add your Jira account to DevStats (in addition to GitHub) to access all these features.
The Flow section provides you with data related to your team's workflow. This includes a more expansive pull request cycle time screen, a tool that allows you to view and manage your open pull requests (Open PR), and a screen that highlights your team's overall throughput using your PR data.
The developer experience (DevEX) section contains tools that allow you to gain more insight into the areas of development that your team members spend most time on. You'll find this section particularly useful if you're using agile methodology with scrum and/or kanban. It contains code review cycle time data, a full work-breakdown screen, an hour-to-hour activity heat map tool, and a daily work-in-progress screen that can help you adjust your WIP limits.
Finally, the Snapshot section contains quick snapshot information related to your cycle times and your team's productivity. It provides you with quick information related to your team's speed, productivity, and collaborative efforts. It also features a DevOps Research and Assessment (DORA) metrics screen.
Conclusion
Cycle time is an undeniably useful metric for development teams as well as sole developers to track productivity. It can be used to provide actionable insights regarding various stages of the coding and integration cycles. It can be used to identify bottlenecks; it can also determine where time and resources are being wasted and the overall efficiency of your workflows and pipelines.
Automatically and accurately calculating your cycle times can be challenging. Time trackers and conventional project management tools tend to be insufficient as they can take time to set up and maintain. The above guide shows you an easier way to calculate your cycle times by integrating DevStats into GitHub. DevStats calculates cycle times around pull requests and delivers this information through a clear, easy-to-use dashboard. If you want to learn more about DevStats, consider booking a demo today!